

Trace how data flows through your project with lineage
Lineage is recorded automatically for Load and Aggregate actions (Python and PySpark), and is opt-in for Custom actions and notebooks through the SDK
Objective
Lineage gives you a built-in, visual map of how data flows through your project: which jobs feed each table, which tables they produce in turn, and how everything connects from source to destination. The graph is built from the OpenLineage events your project records as jobs run, with nothing to install or configure.
Lineage is recorded automatically for Load and Aggregate actions (Python and PySpark), and is opt-in for Custom actions and notebooks through the SDK. Lineage for Trino queries (Explorer, Analytics Manager) is coming soon. See what generates lineage events below.
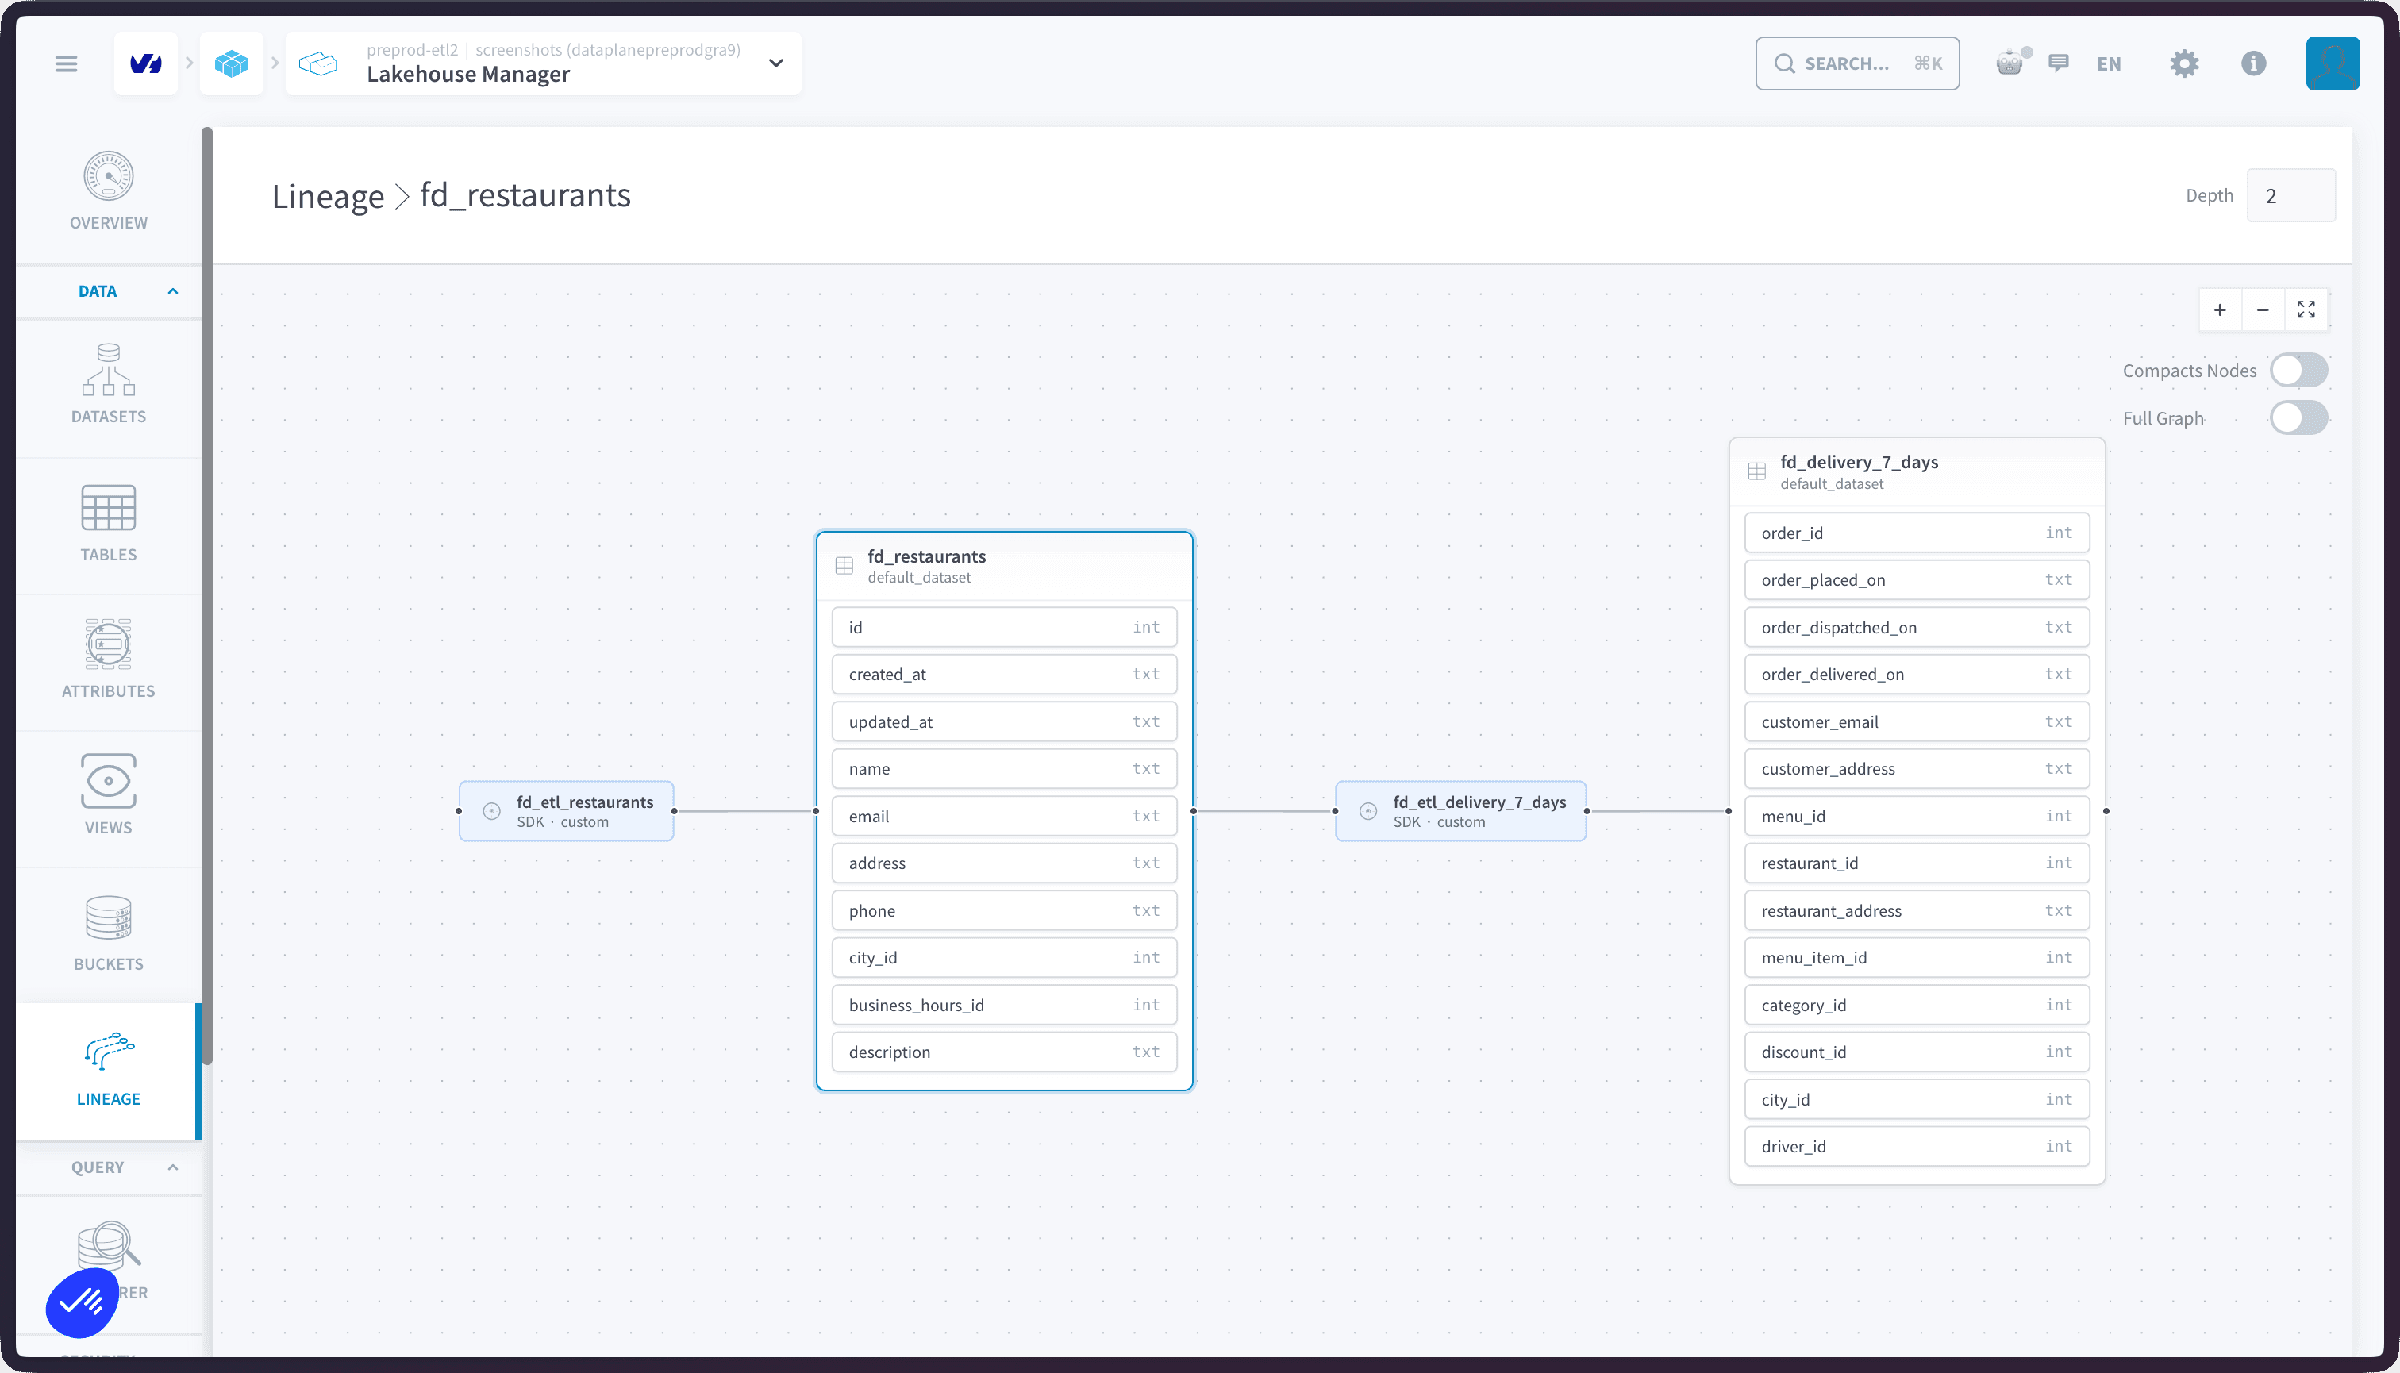
Open the lineage view
There are two ways to reach the lineage of a table:
- From the Lineage section of the Lakehouse Manager: the page opens on a search bar where every table of your project is searchable. Start typing the name of the table whose lineage you want to see and select it to display its graph.
- From a table's details view: click the Lineage button to jump to the lineage page with that table already displayed.
Explore the graph
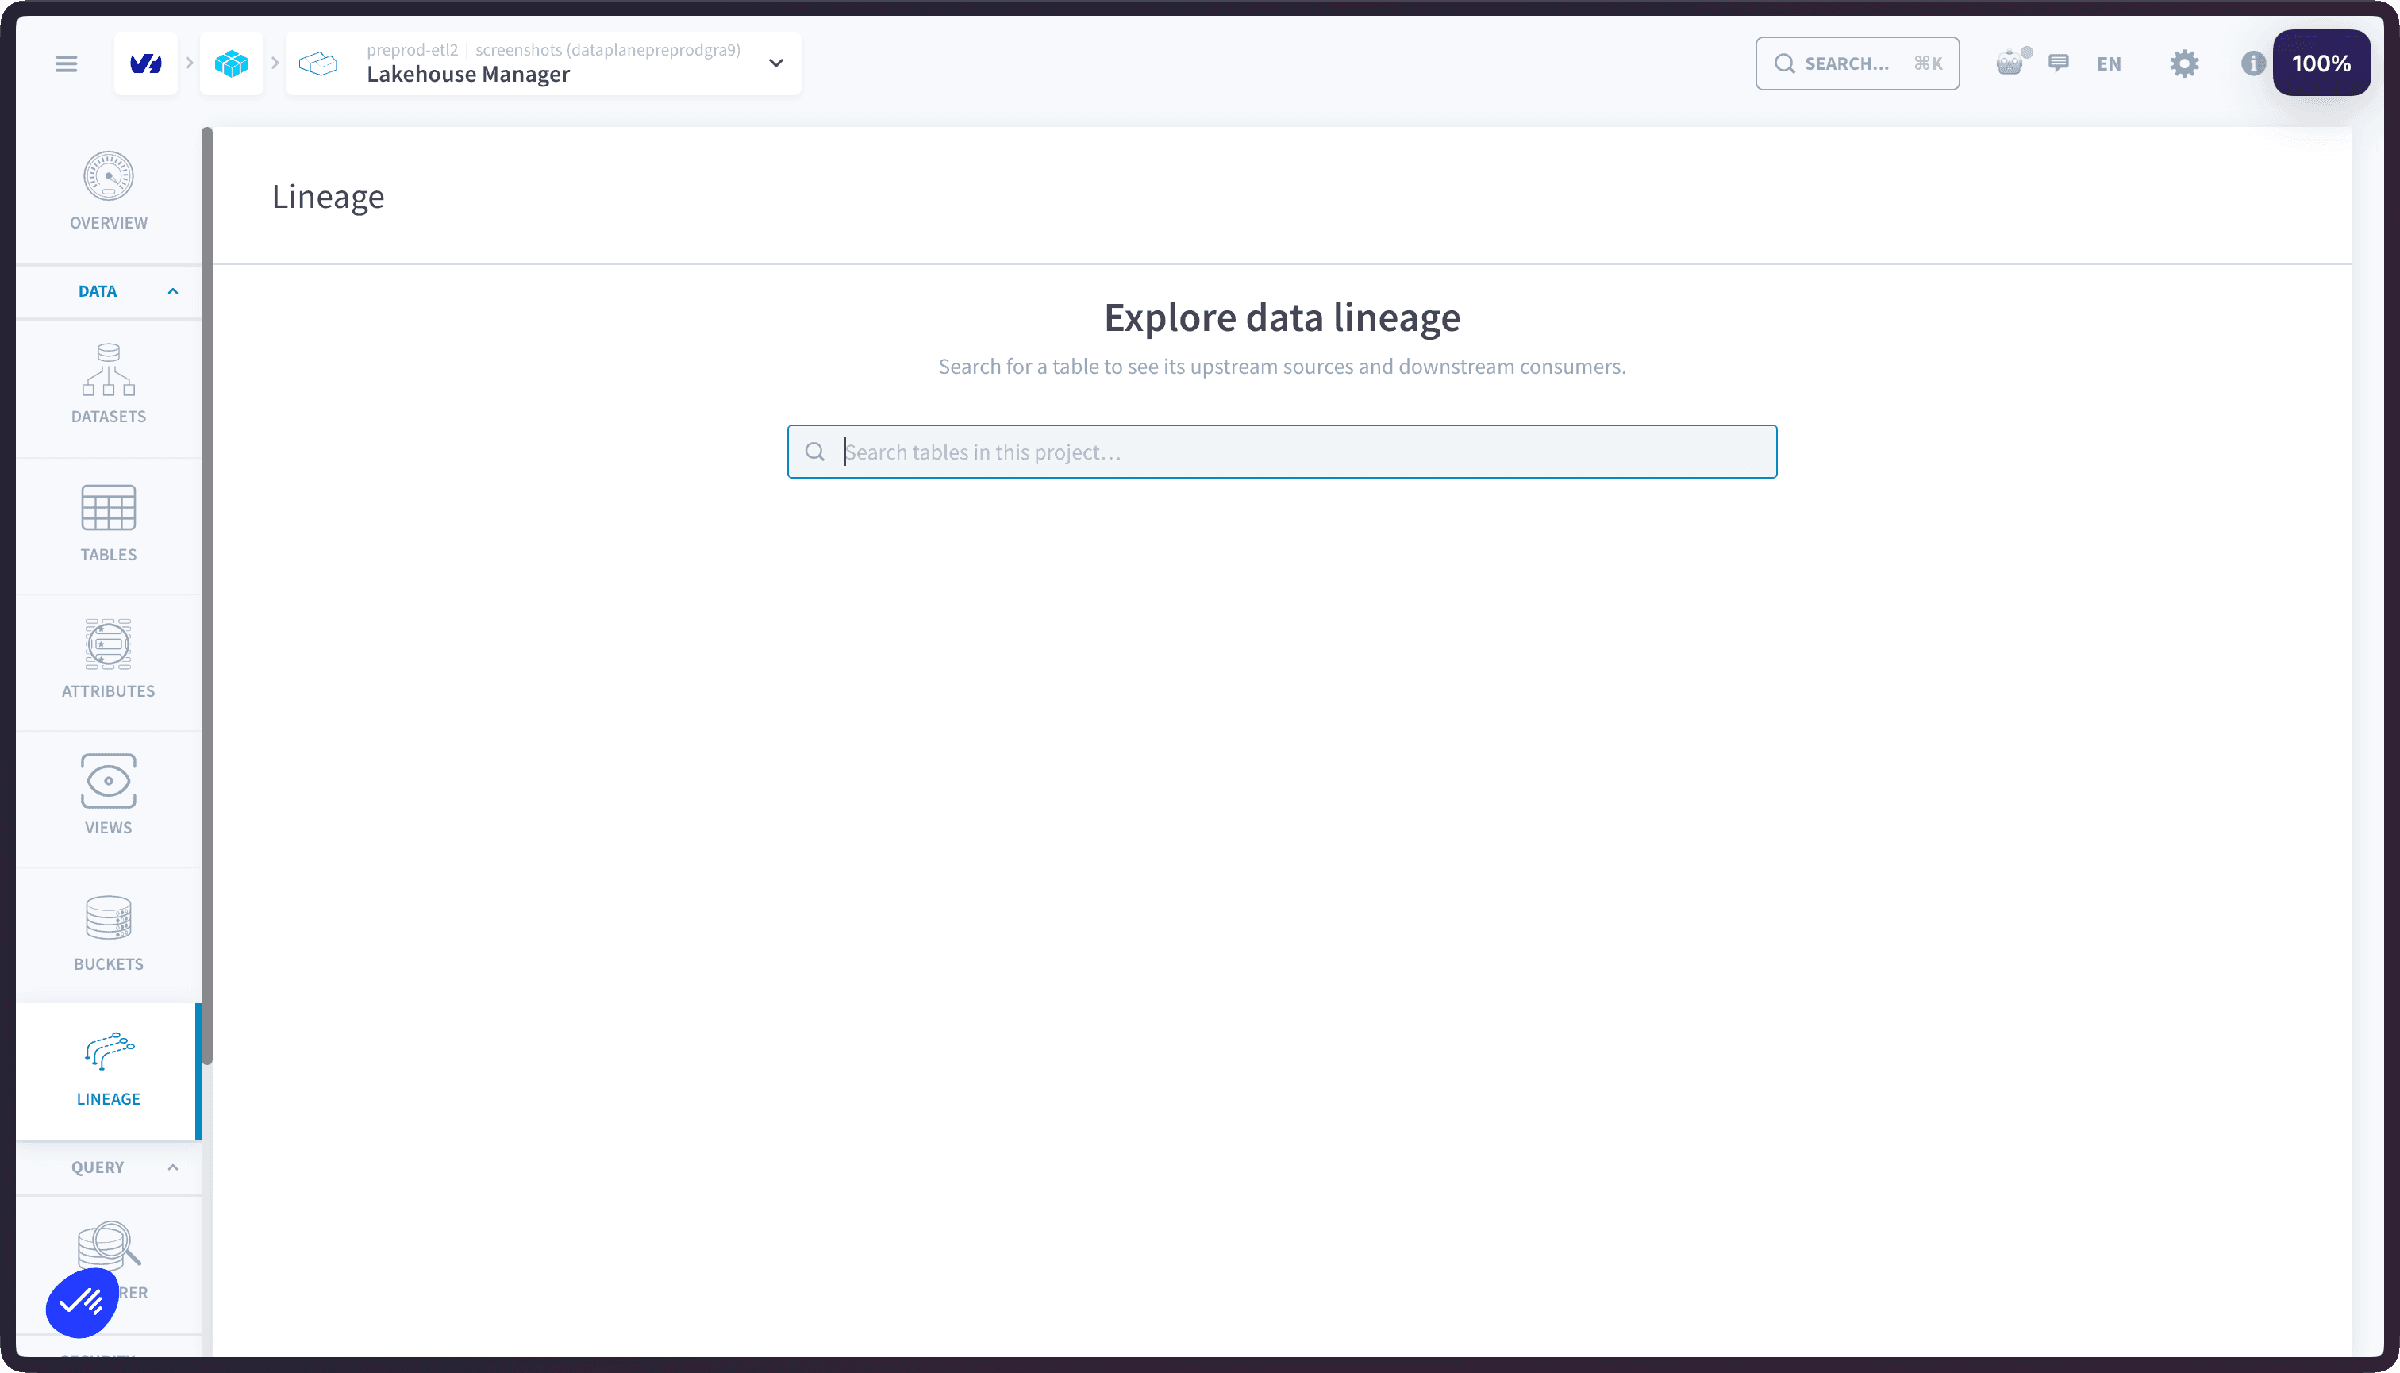
The graph starts out from the table you selected: your central node, marked with a blue outline so you never lose track of where the graph begins. Around it, the graph shows the tables and jobs it connects to: the jobs and tables your table is built from upstream, and everything built from it downstream.
The graph is made of two kinds of nodes: table nodes, which list their columns, and job nodes, the runs that link tables together by reading and writing them.
The graph is never empty: a table without lineage yet is simply displayed on its own, without connections. Lineage appears as soon as a job run finishes, so a fresh run shows up immediately.
Table nodes
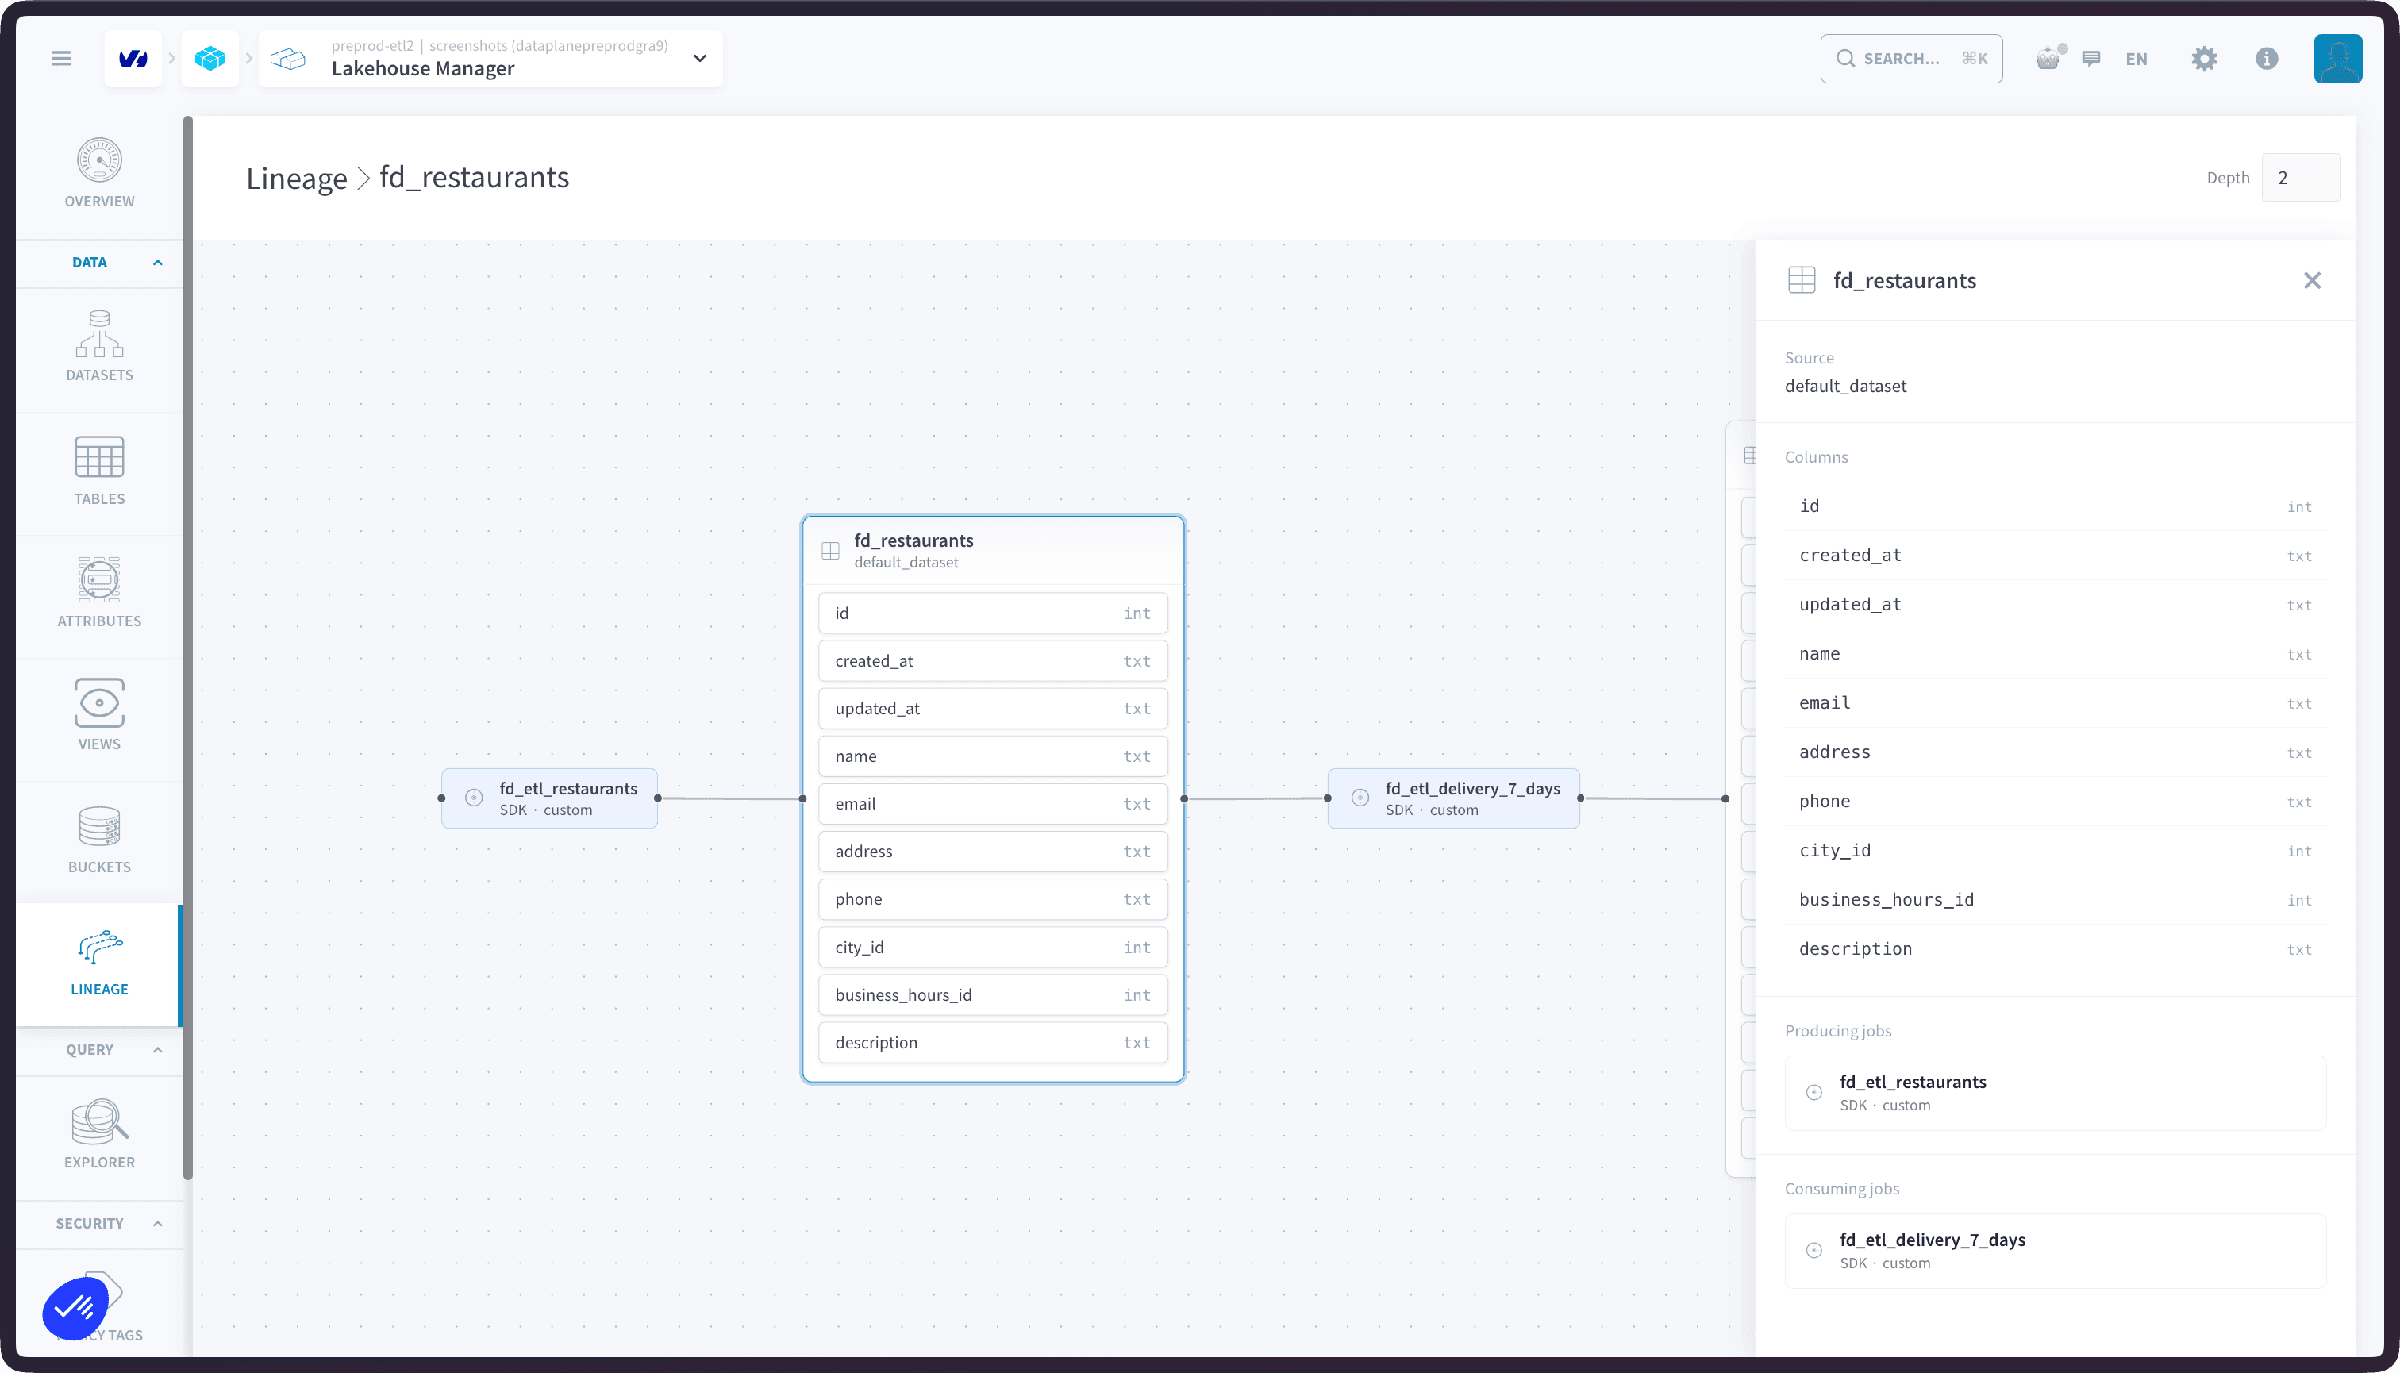
Click a table node to see the table's details: its dataset, its columns, the producing job(s) that write it, and the consumer job(s) that read it.
Clicking another table node shows its details but does not re-center the graph: to start out from a different table, select it from the Lineage search bar instead.
Job nodes
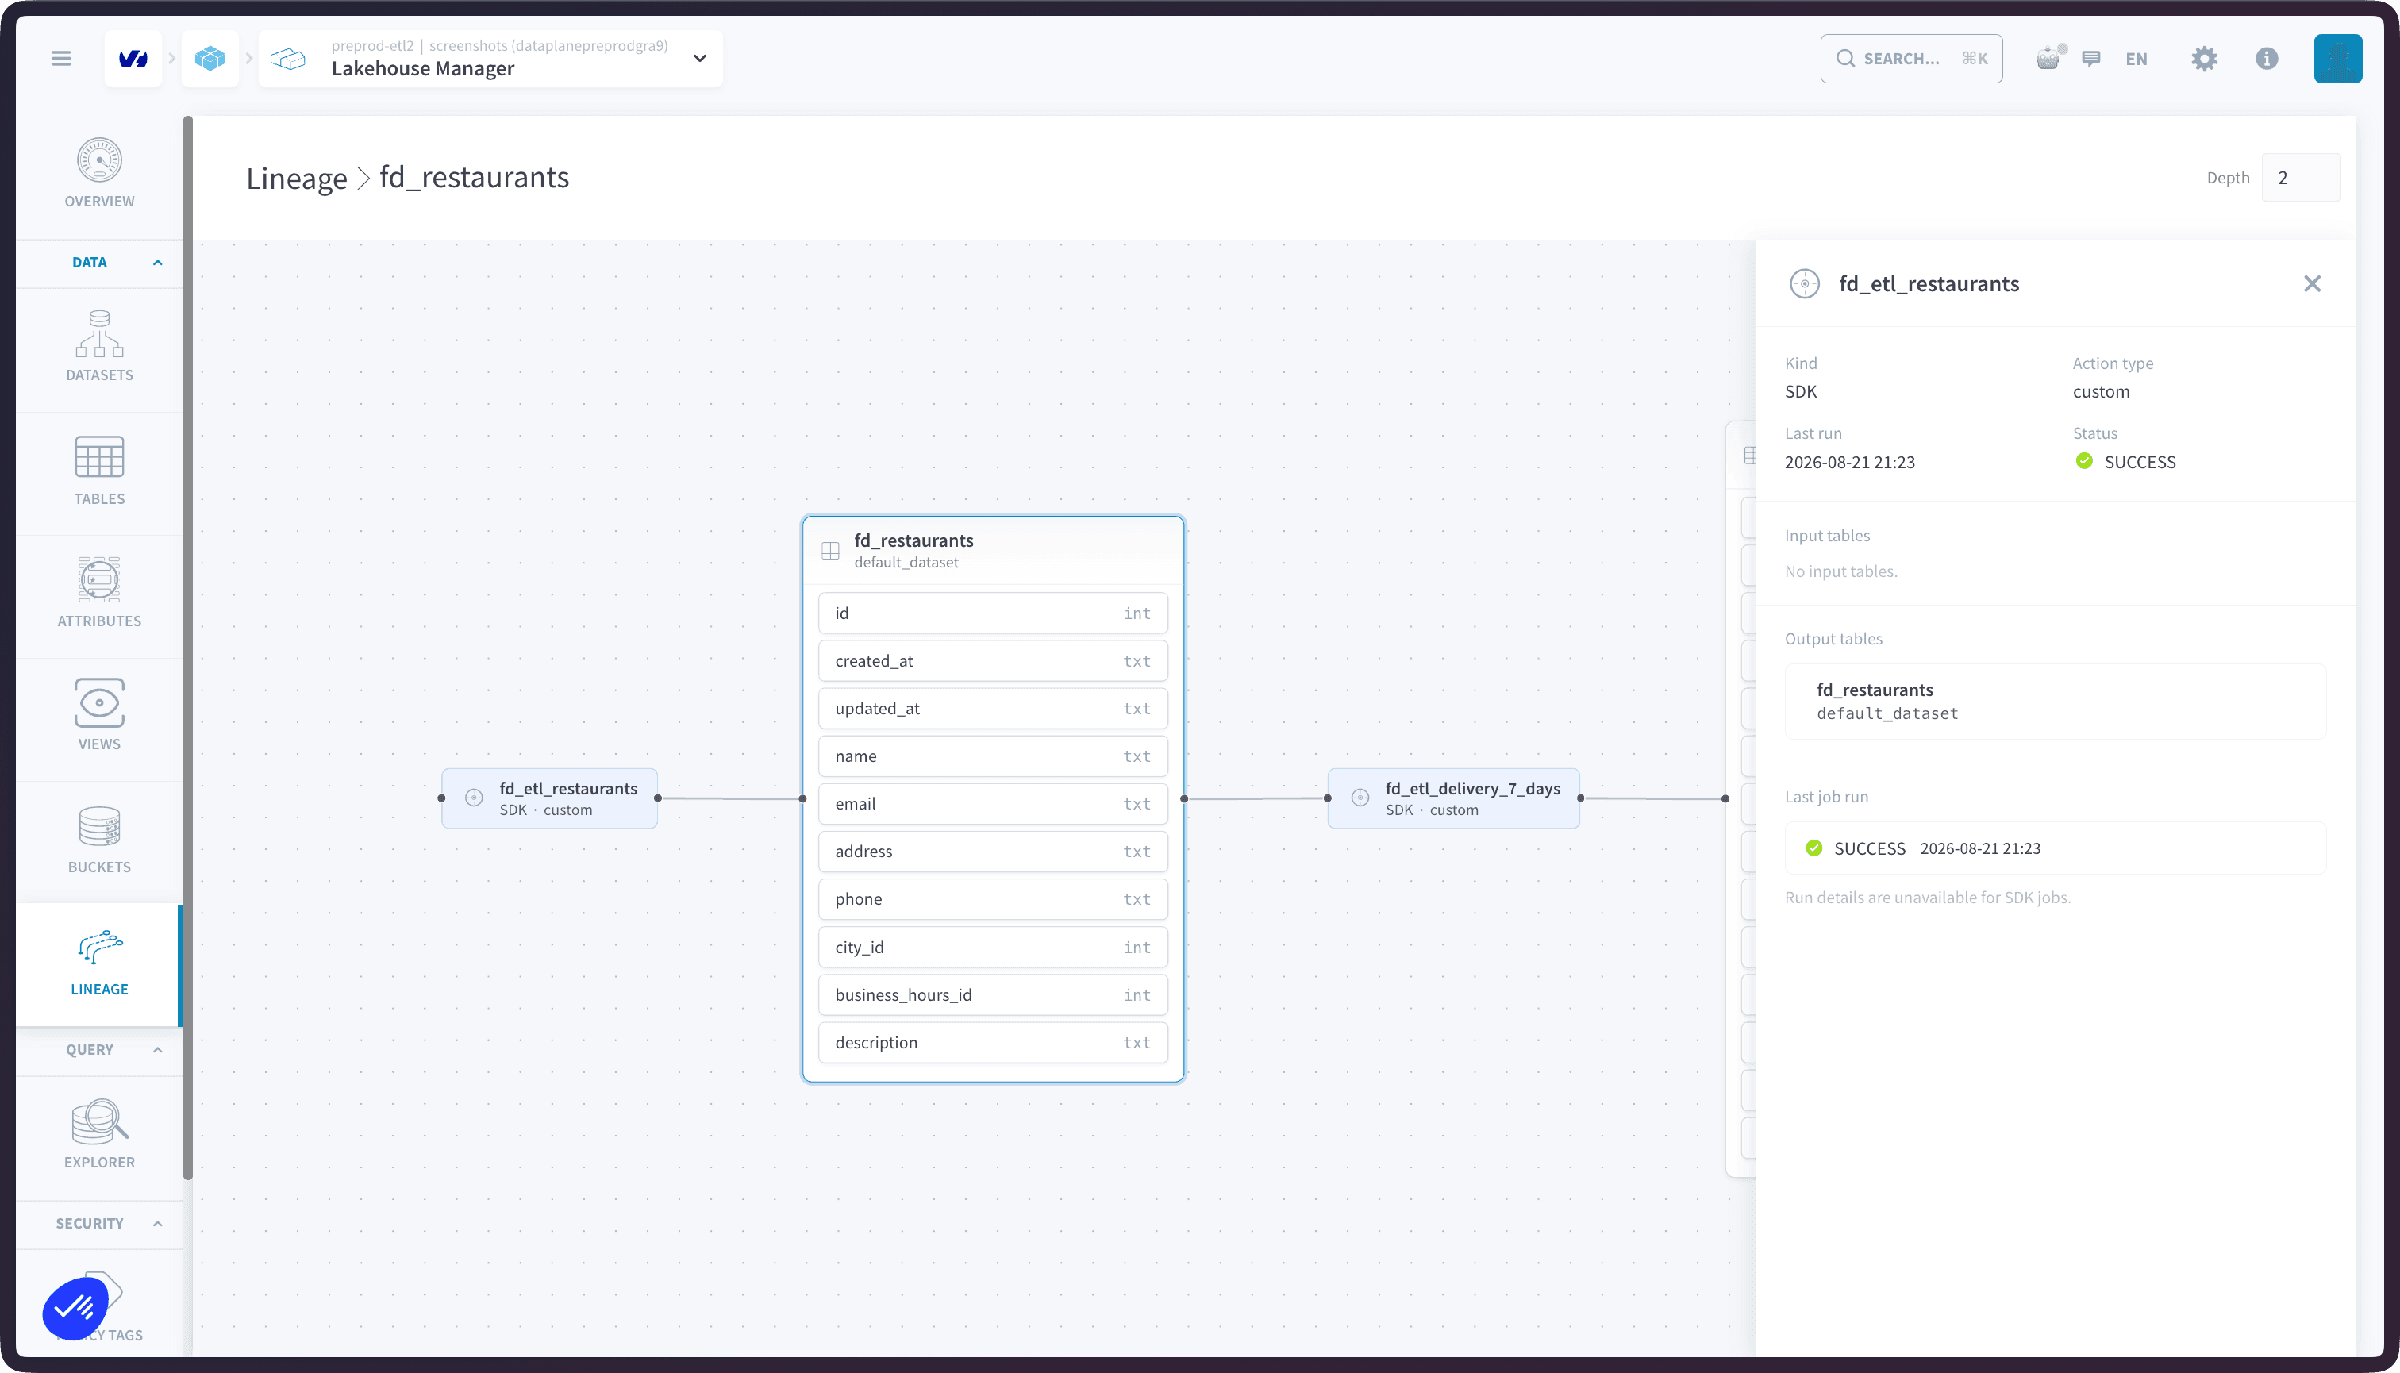
Click a job node to see the run behind the connection:
For DPE and Lakehouse jobs, a direct link at the bottom of the details opens the job itself. SDK jobs have no link, since they are lineage you emitted yourself through the SDK helpers.
Graph controls
The controls at the top right adjust what the graph displays:
- Full graph toggle: also shows the sibling tables, on top of the producers and consumers already displayed.
- Compact nodes toggle: a minimal view of the nodes, without their columns.
- Zoom in, zoom out, and fit to screen.
- Depth: how many upstream and downstream levels the graph displays, from 1 to 10 (default: 2); increase it to follow the flow further.
Column-level lineage
Beyond table-to-table flows, Lineage also tracks how columns connect across tables: for a given column, which upstream columns it is computed from, and which downstream columns are computed from it.
Click a column on a table node in the graph, or a column in the table details, to switch to its column lineage. When lineage is available, the graph connects the columns across tables to show how they relate. A column with no lineage of its own is shown as independent, with a blue outline marking it as solo.
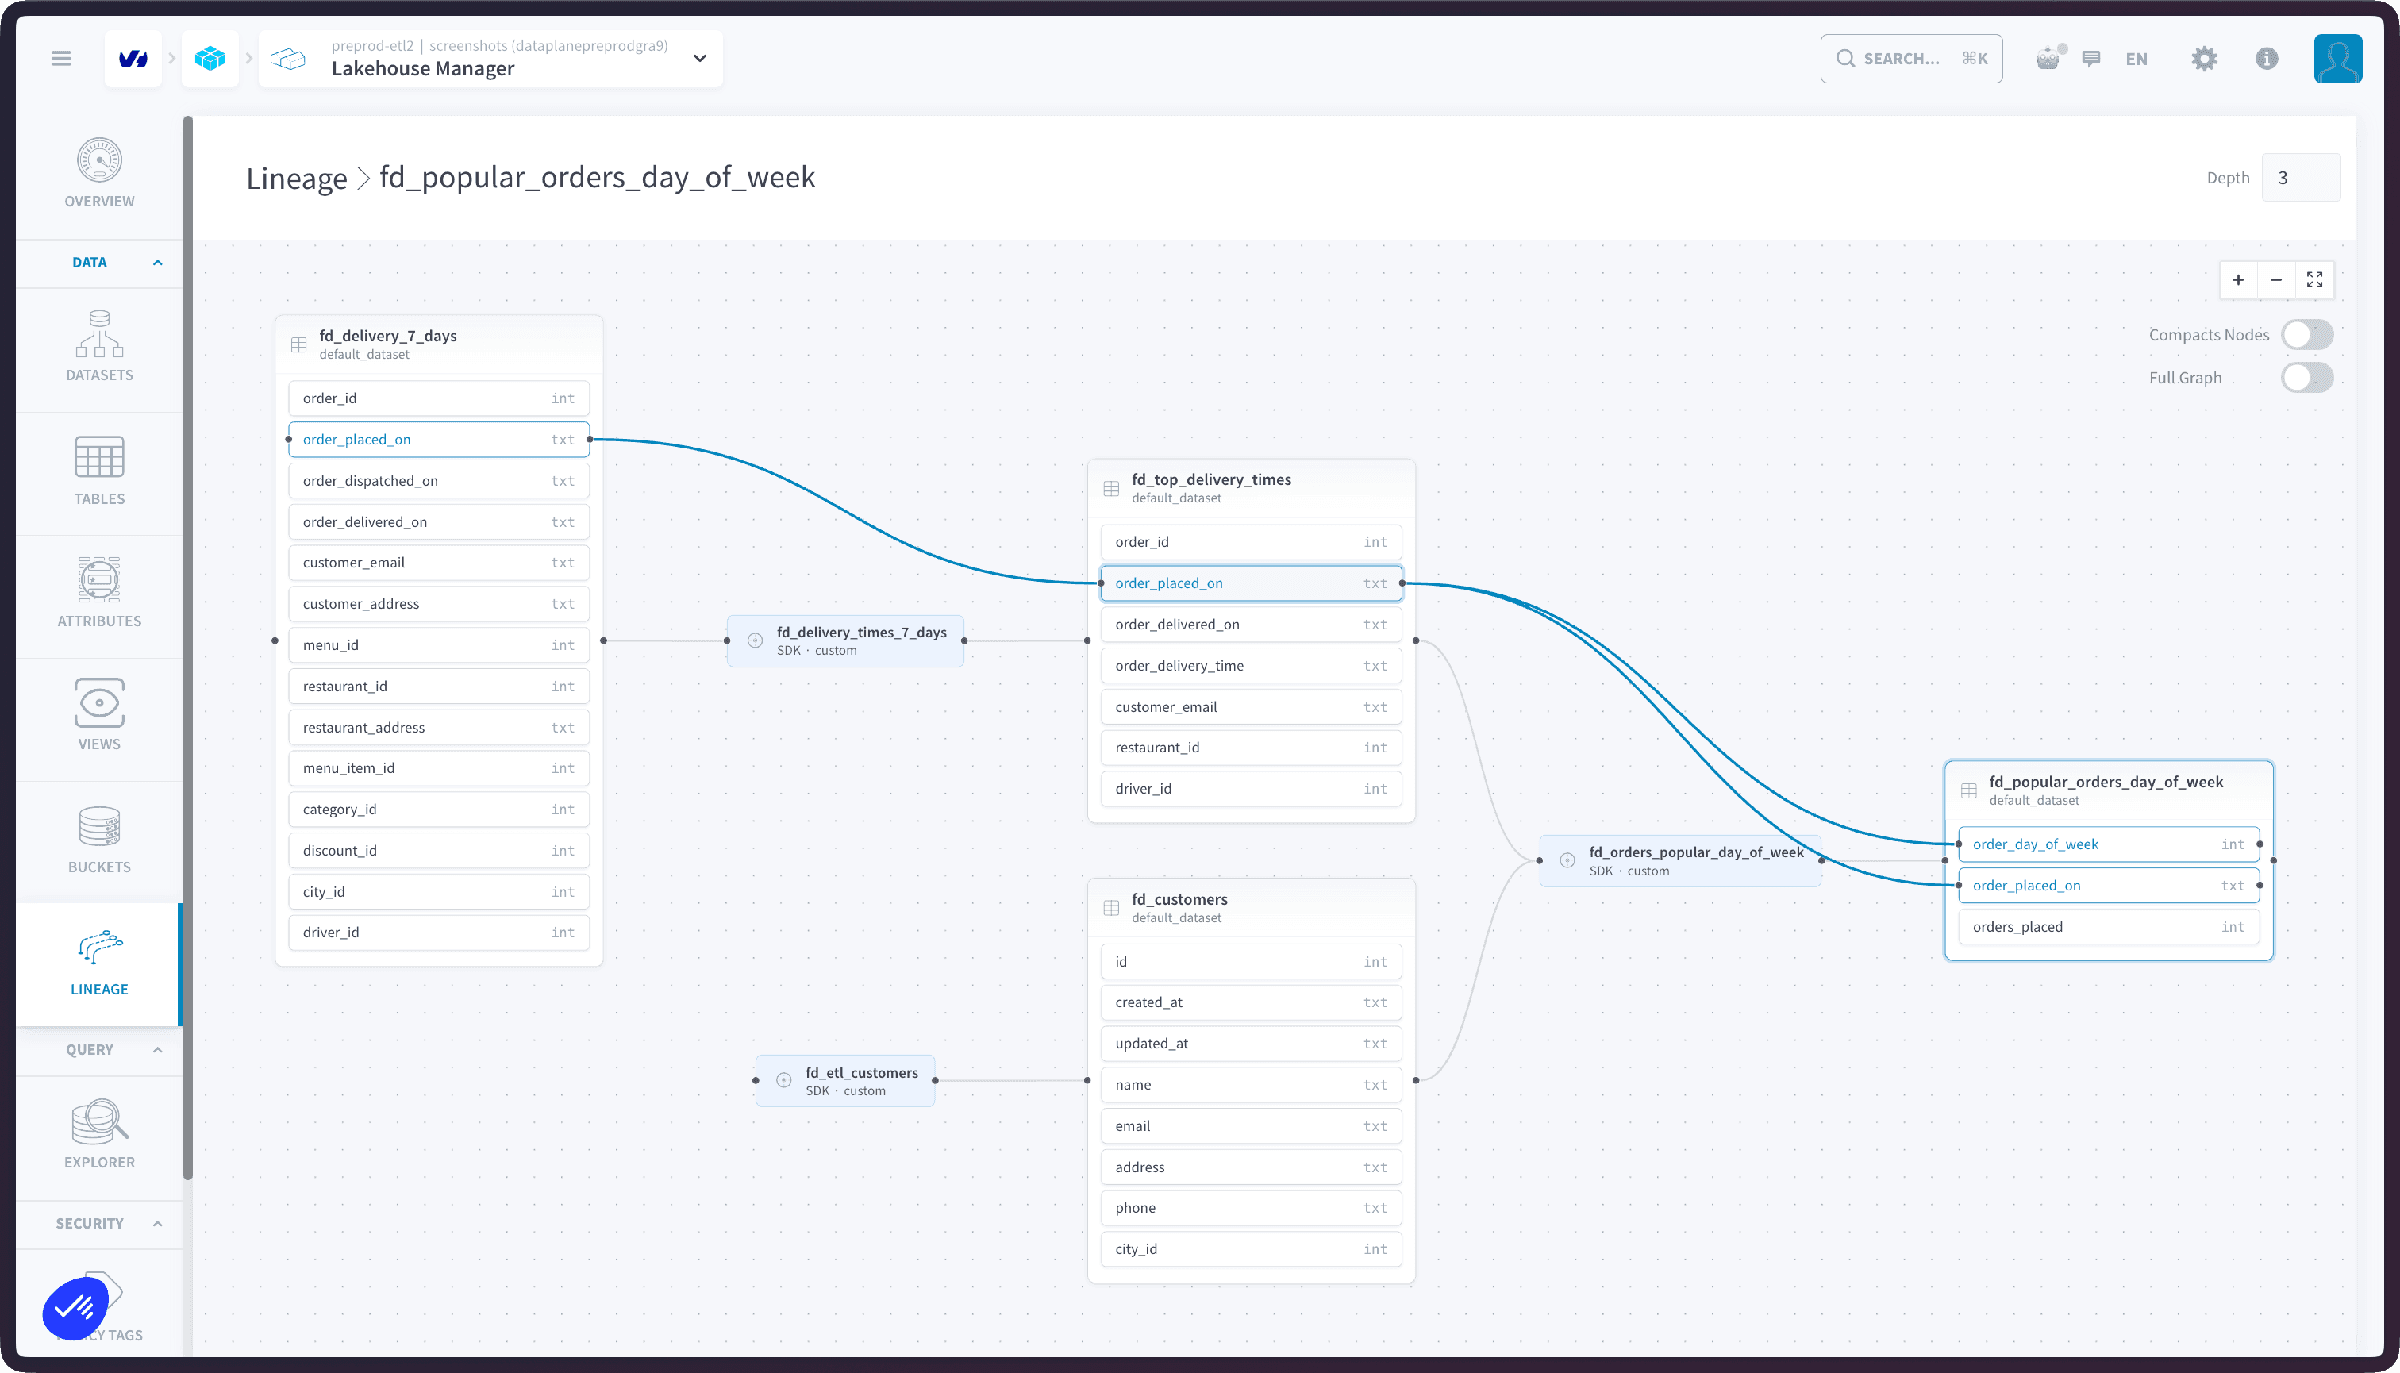
Column-level lineage is not available while Compact nodes is enabled: switch the toggle off to click through columns.
What generates lineage events
Use your own lineage tool
The same OpenLineage events can be forwarded to an external lineage solution such as Marquez. Configure the OpenLineage consumer and schedule the Send OpenLineage Events action to stream them to your backend.
Go further
If you need training or technical assistance to implement our solutions, contact your sales representative or click on this link to get a quote and ask our Professional Services experts for a custom analysis of your project.
Ask questions, give your feedback and interact directly with the team building the Data Platform on the dedicated Discord channel.
If you need support with your OVHcloud services, create a request in our Help Centre.
Join our community of users.