

Create queries on your data
The Analytics Manager allows you, thanks to a low-code approach, to prepare and centralize the queries matching your business KPIs
Objective
The Analytics Manager allows you, thanks to a low-code approach, to prepare and centralize the queries matching your business KPIs. This component constitutes the interface between your data scientist team and your application developer team.
Pre-requisites
Beforehand, you need to make sure all the previous steps of the Project are up and running. Your Lakehouse Manager schema was built properly and your workflow ran smoothly.
In this tutorial, you will build your first queries.
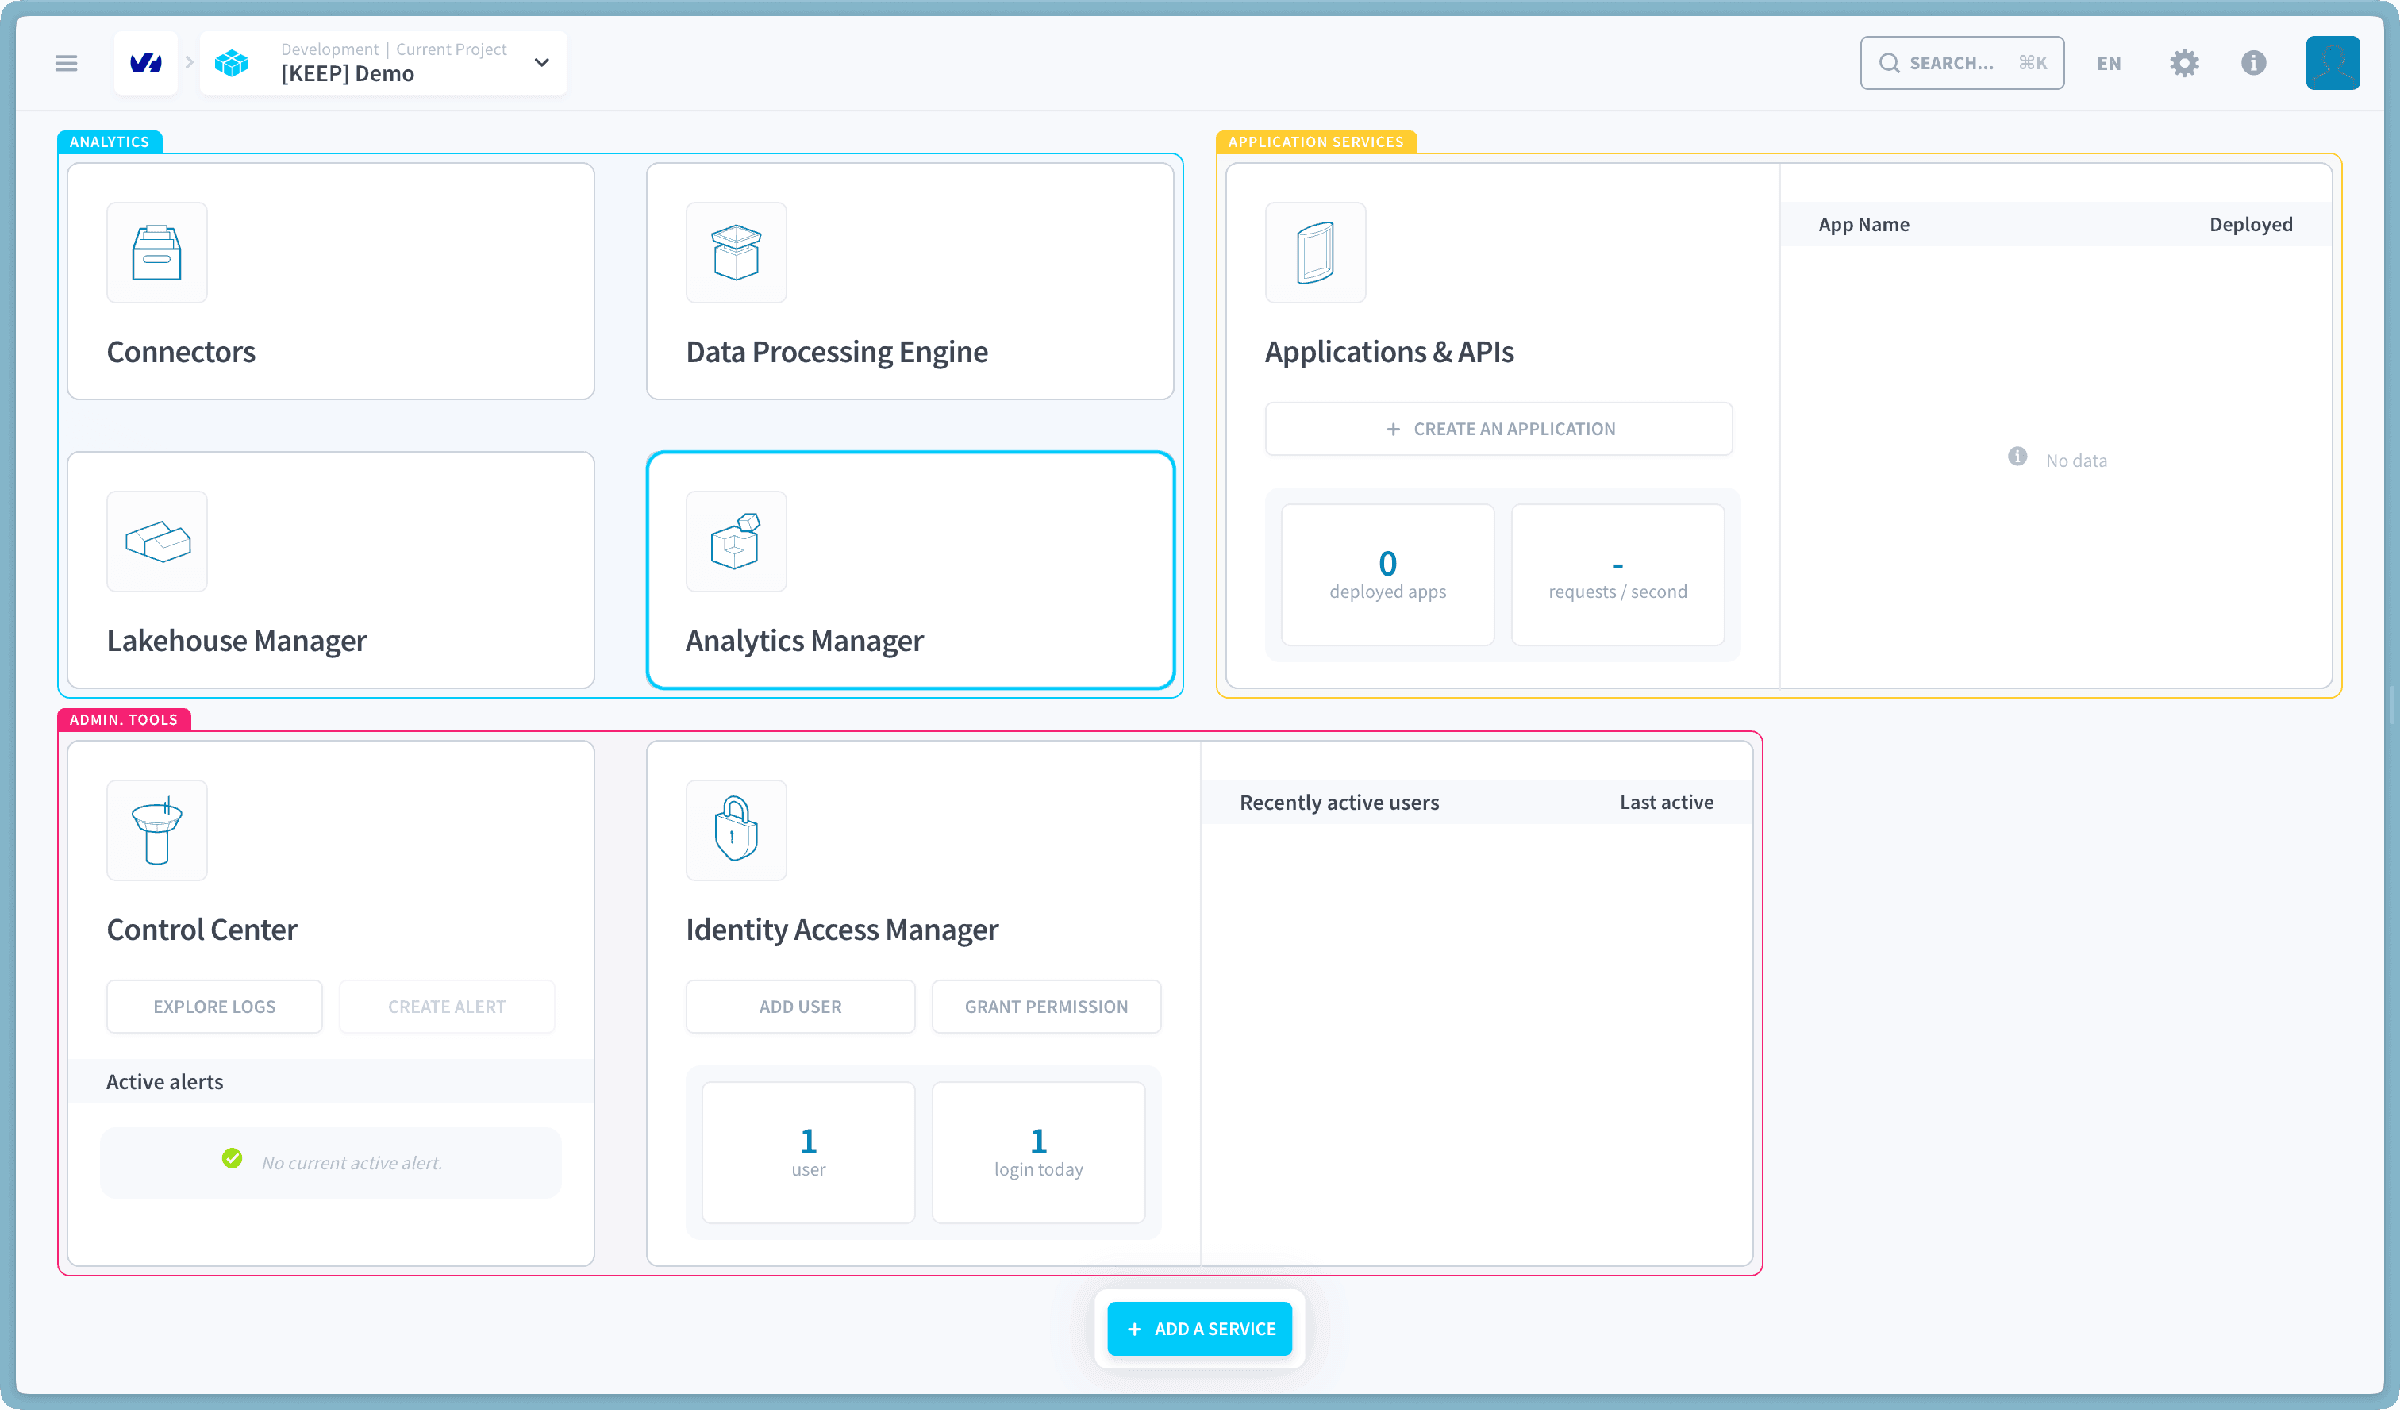
Build your first queries
Now, you will create your first queries in order to make data ready for visualization:
- rides_per_month to understand the average number of rides each month. You'll use it to build your first graph.
- rides_per_cat_temperature to understand the average number of rides depending on temperature.
Create the first query
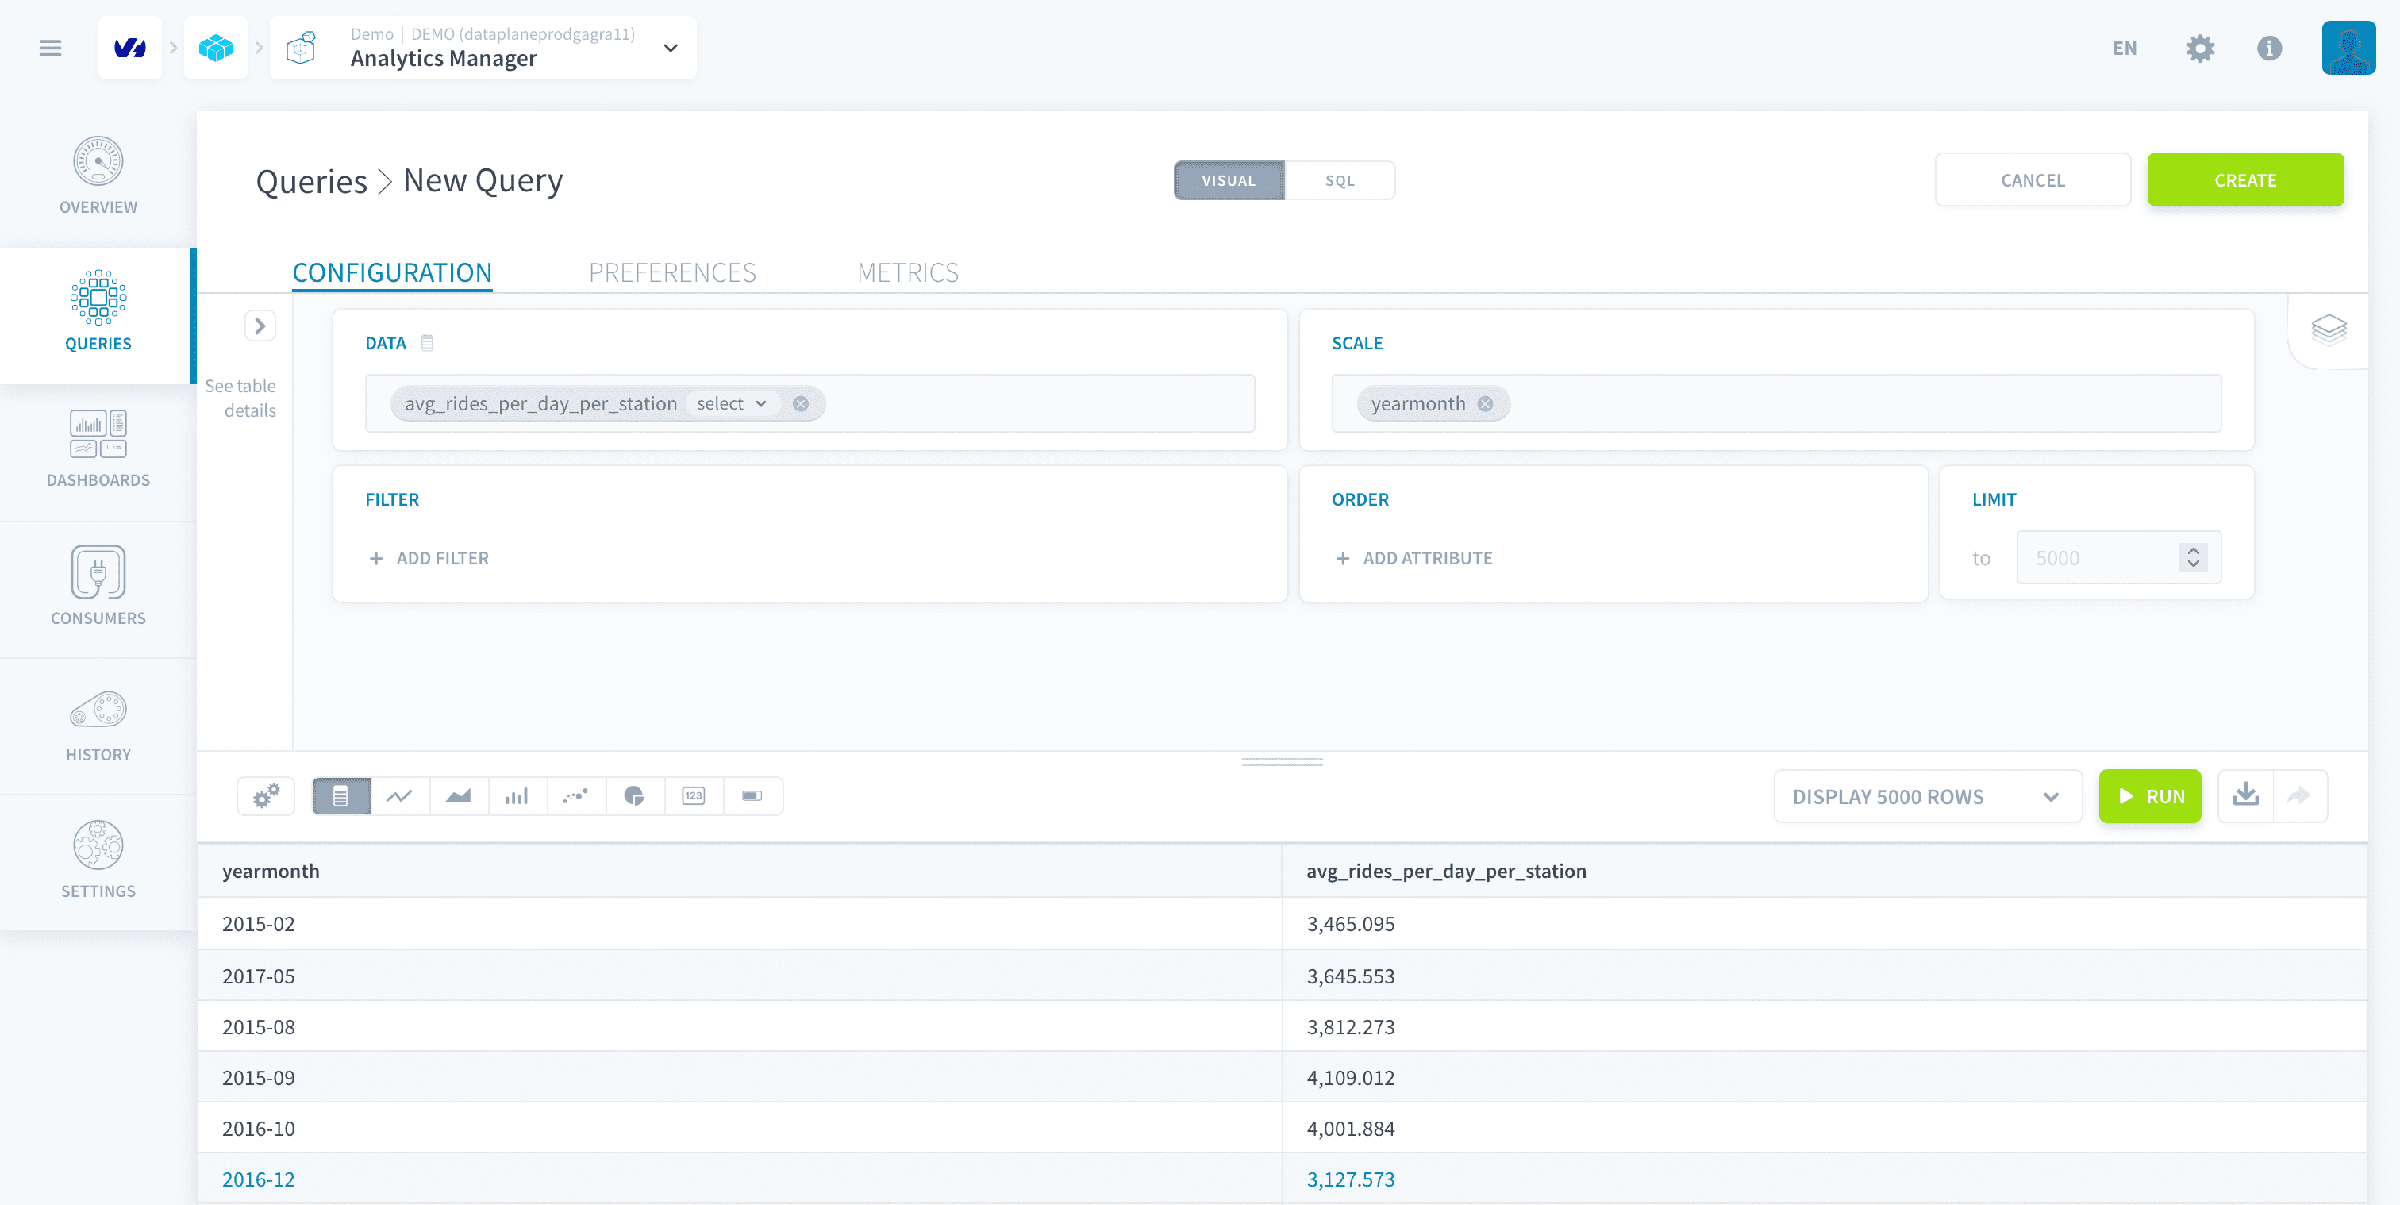
Open Queries in the sidebar and then click on New Query. This will open the Query window where you can give your query a name, parametrize the data as well the scale, order the results and add filters. In this screen, you can also view the results of your queries with tables or charts.
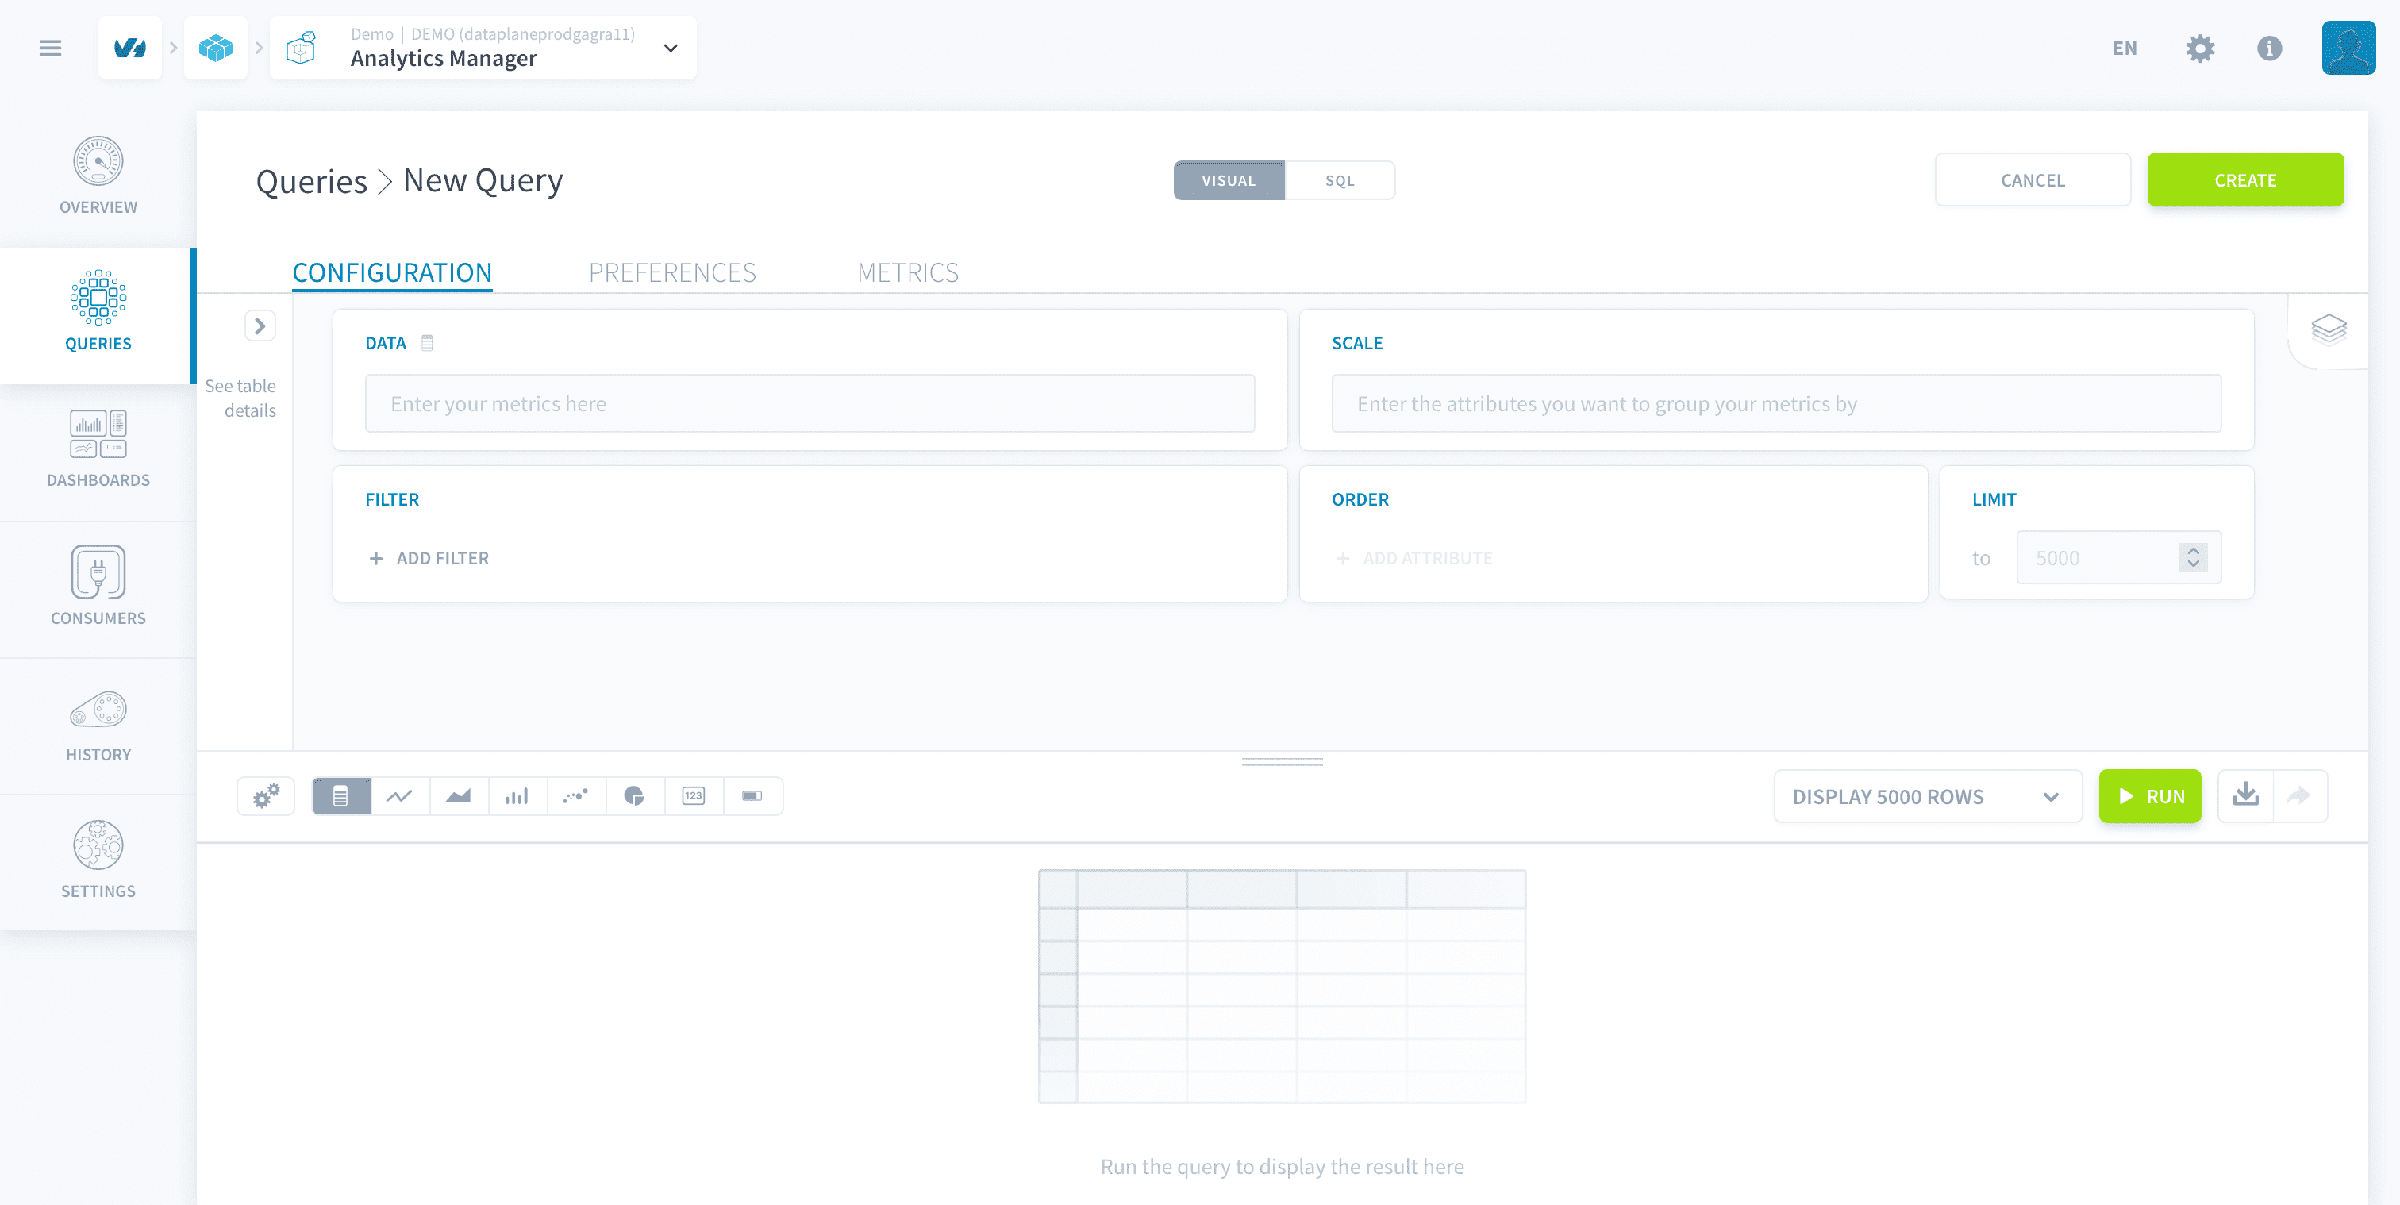
To begin with, name your query rides_per_month.
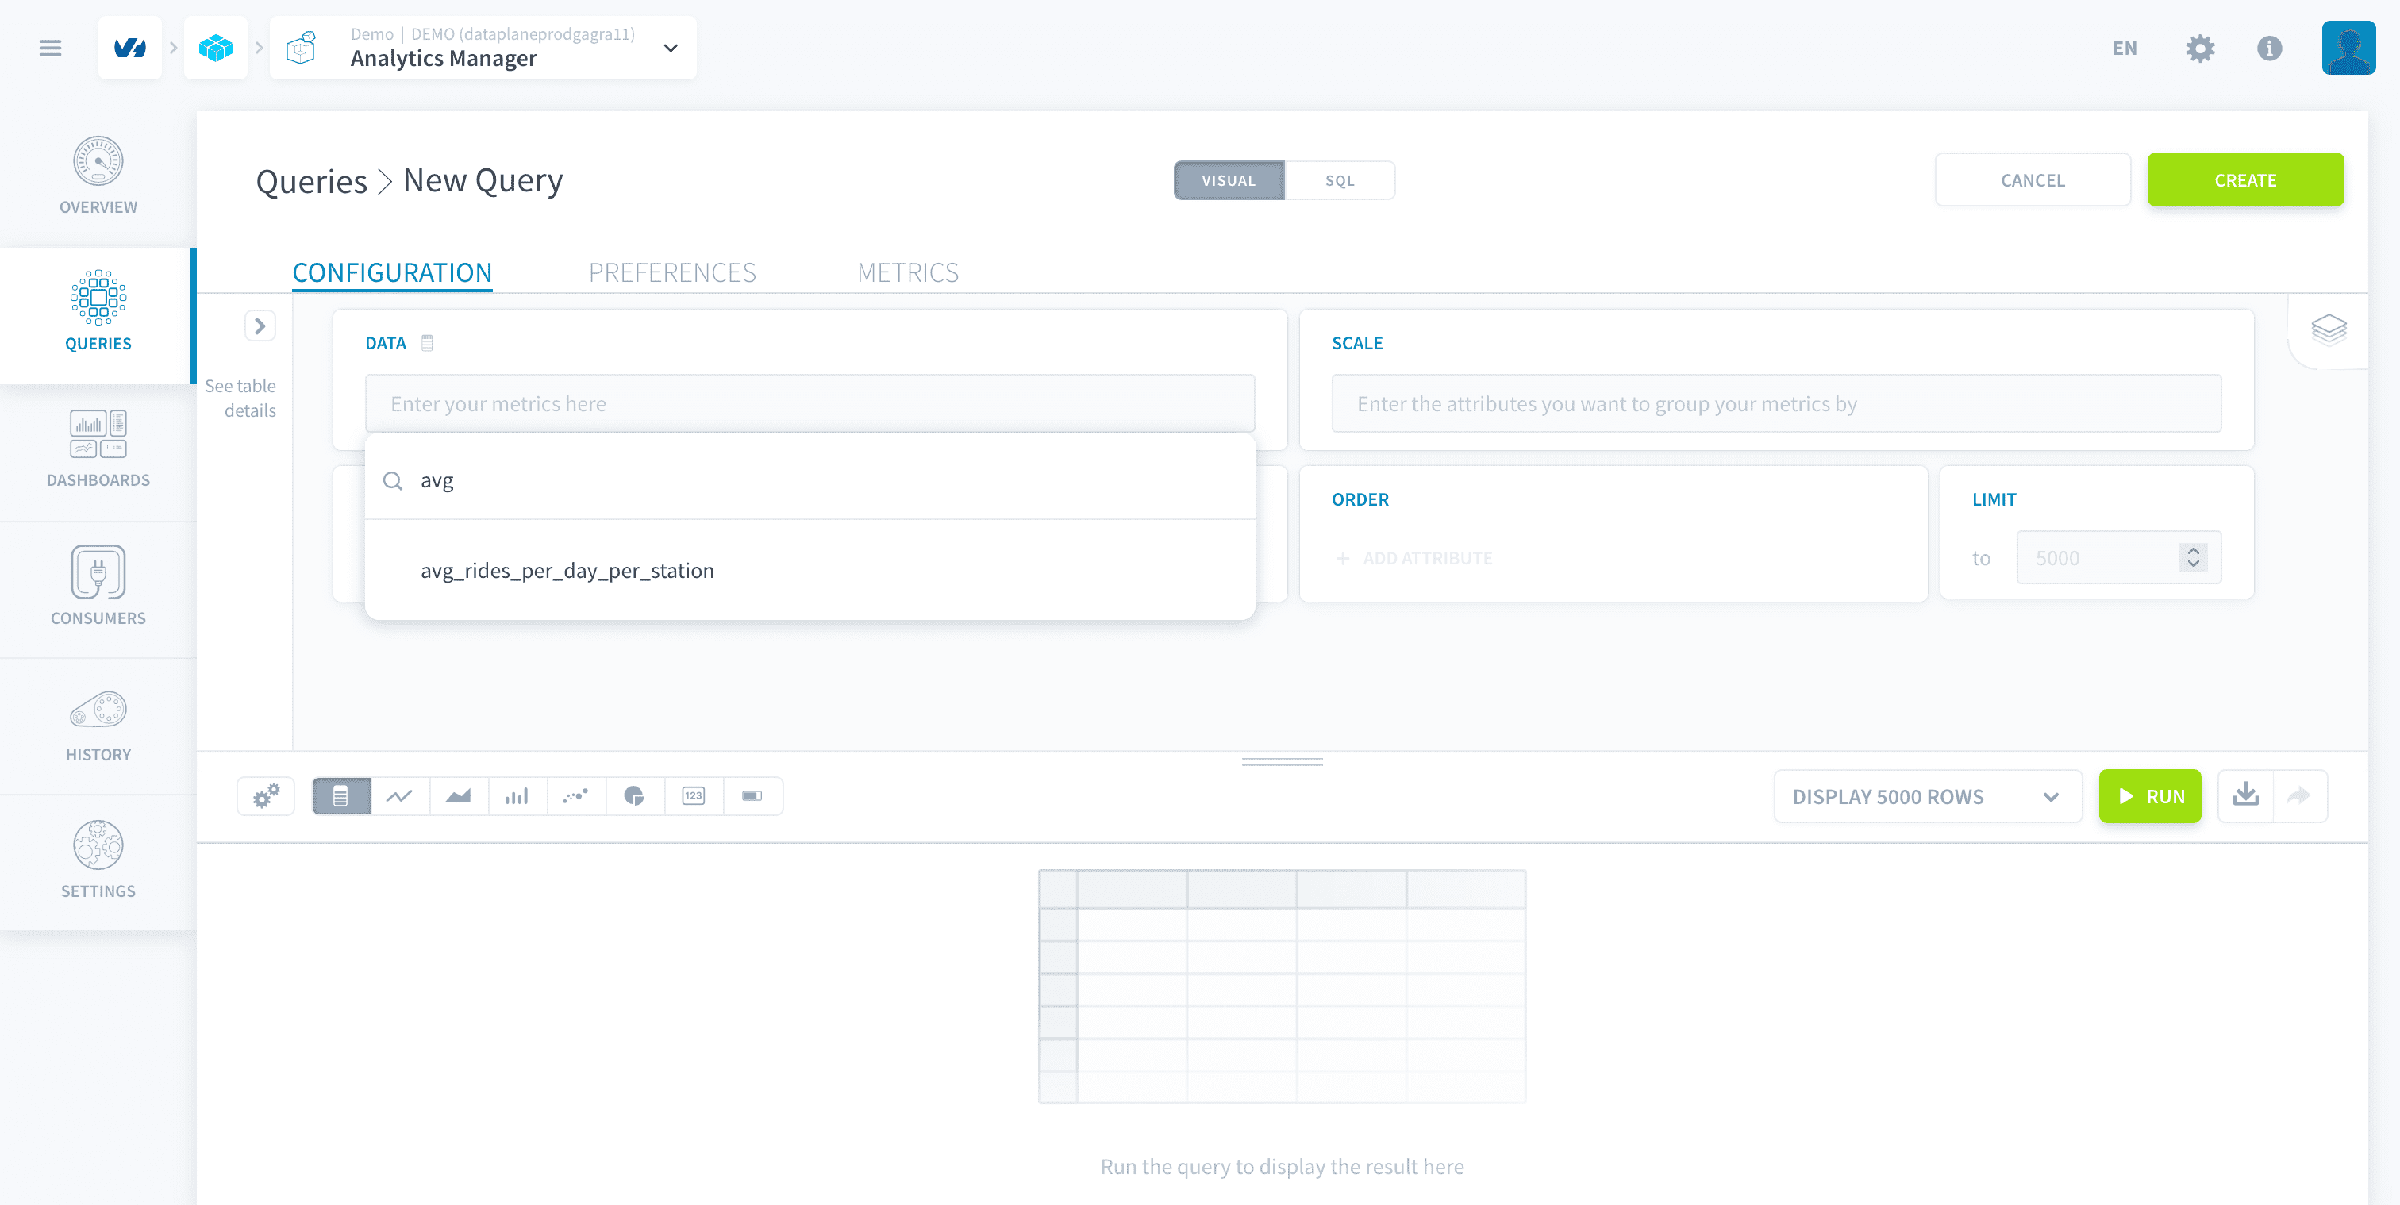
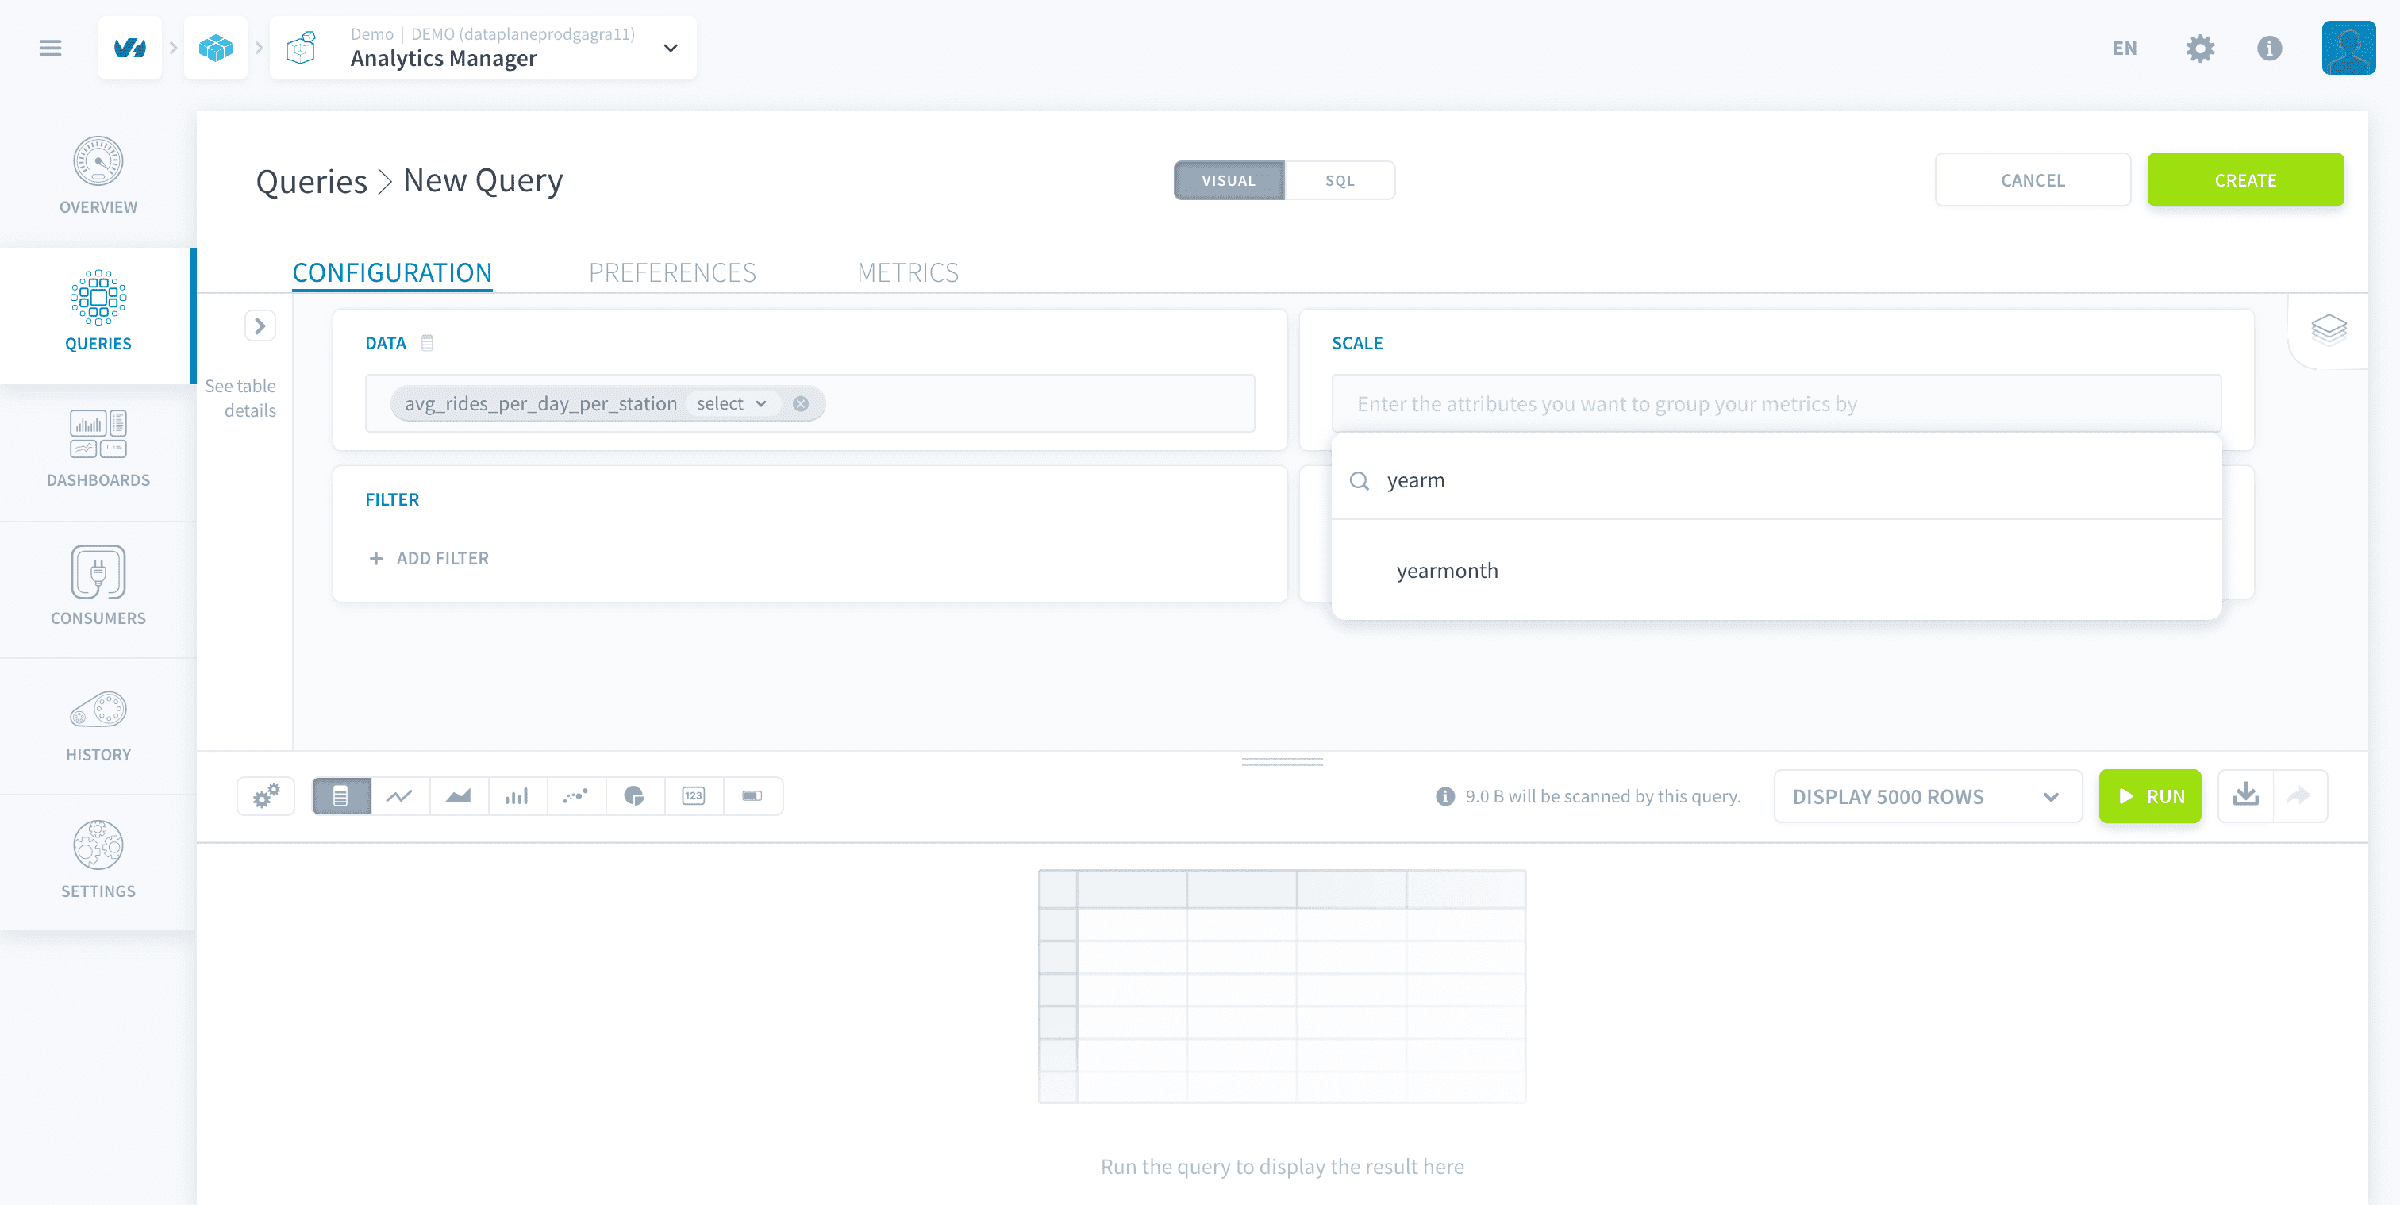
Then start typing 'avg_' in the Data search bar and click on the avg_rides_per_day_per_station attribute.
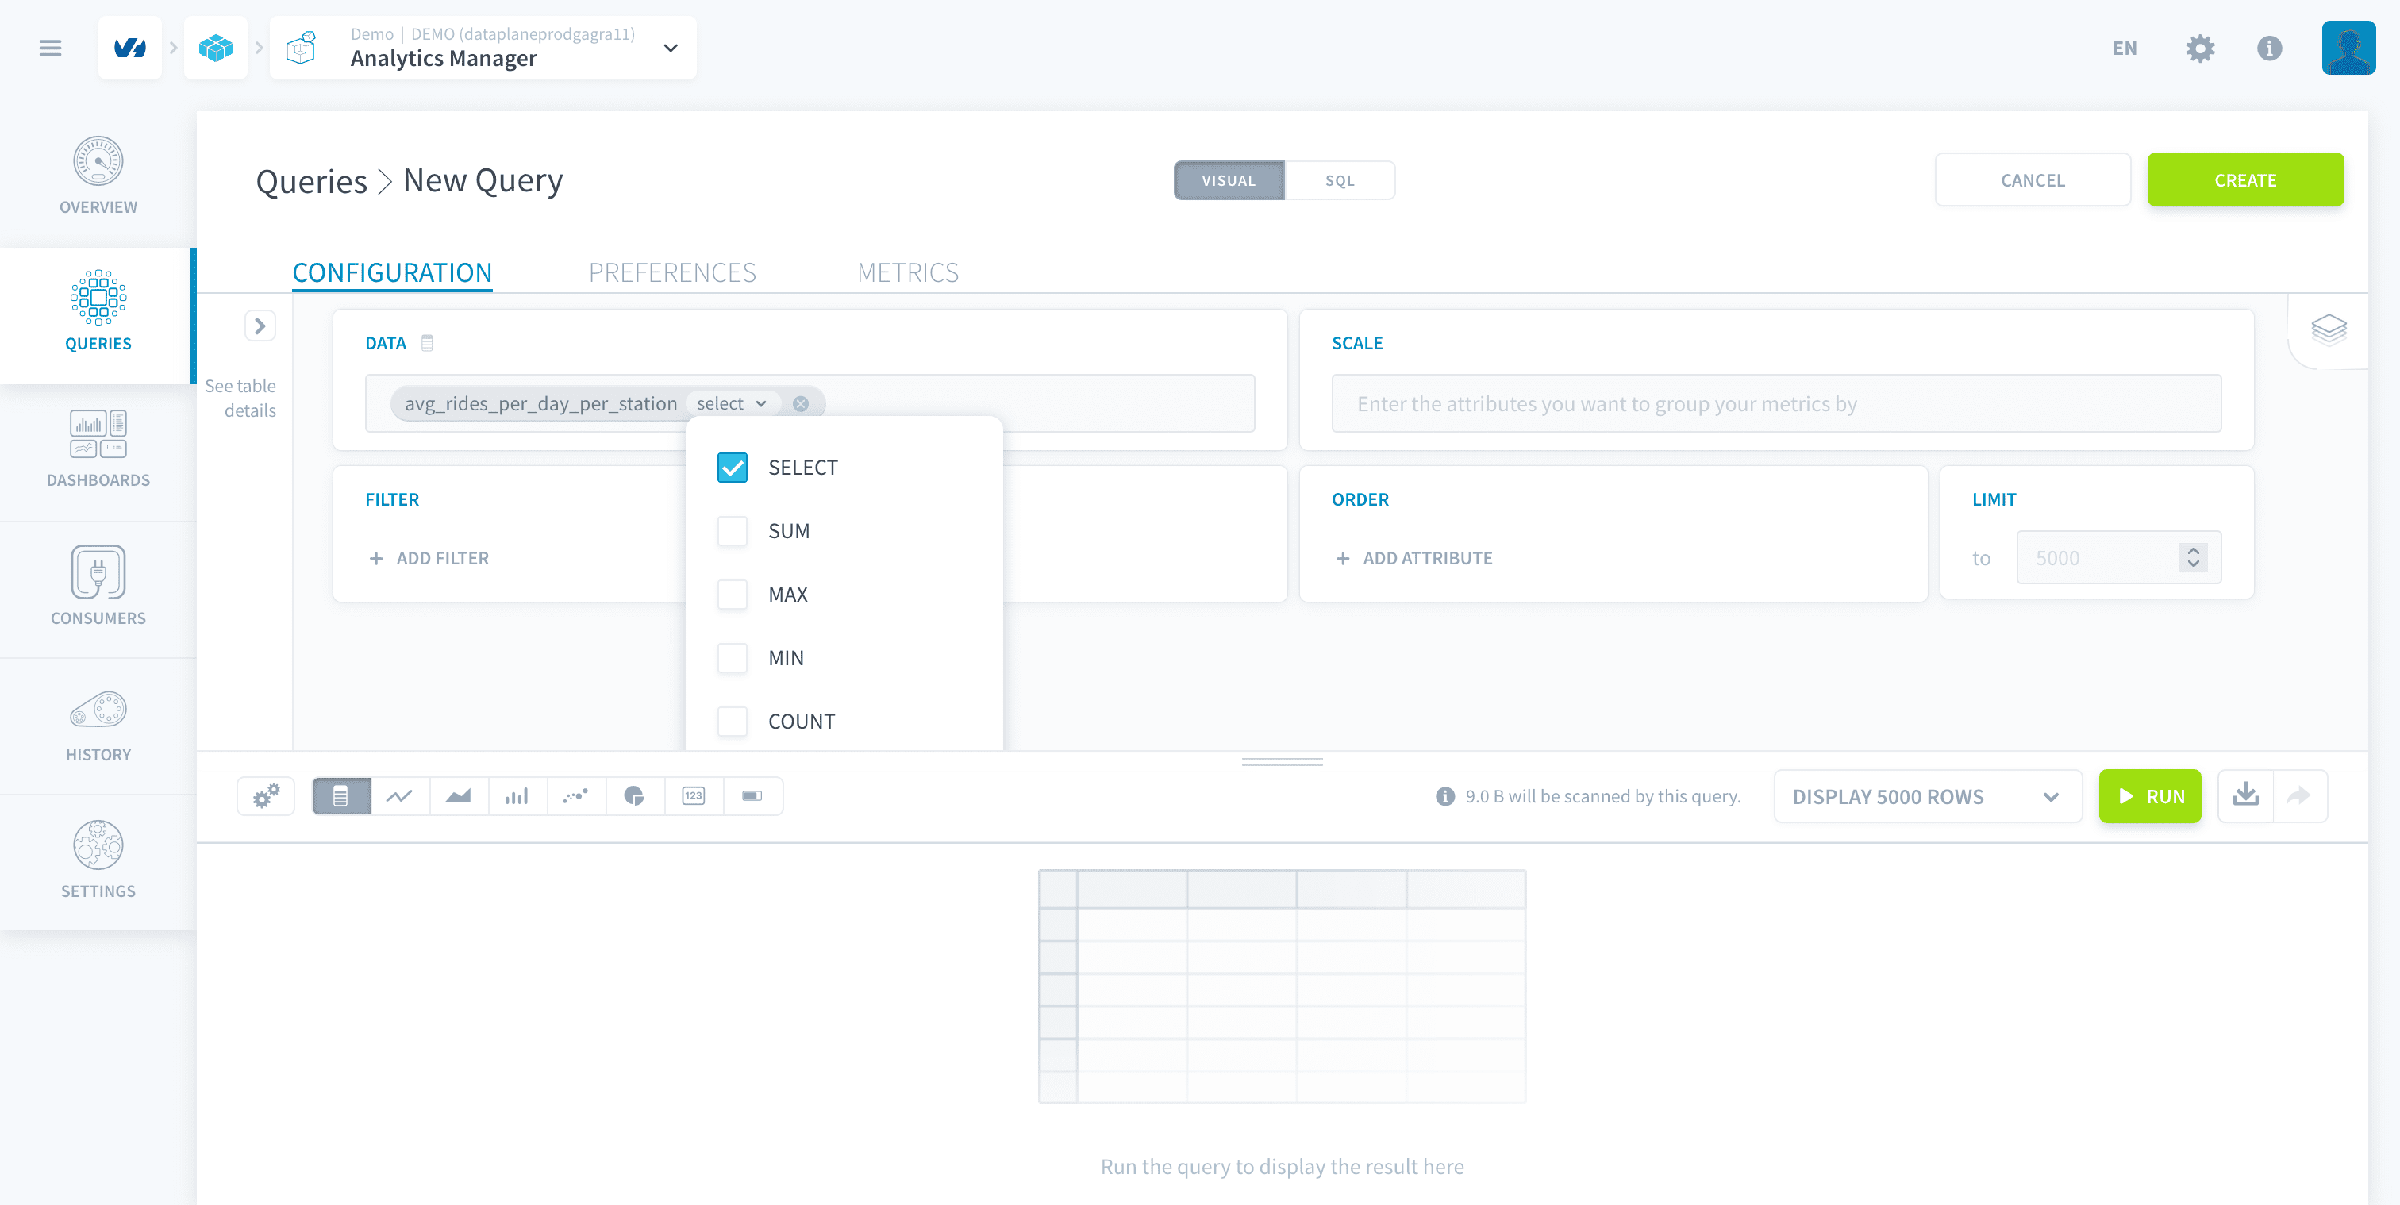
The compute mode is select by default, you can change it by clicking on the arrow and changing the selected options. For the purpose of this tutorial, leave it as it is by default here.
Then, click on the Scale search bar. Here, you want to display the average number of rides each month per date. Select yearmonth as a scale.
Then, click on the green button Run to run the query. You'll see the result of the query at the bottom panel, by default it is on table view.
You can change the display format: table, line chart, bar chart, area chart or pie chart. Choose by clicking on the buttons of the bottom panel (as indicated in the image below).
When you build a query in the Analytics Manager, you don't have to specify the table names. The Platform will automatically choose the most suitable table. But you can still force a specific table by clicking the table icon next to Data.
Learn more about how the Analytics Manager works.
Create a second query
Queries aren't meant to be used in a dashboard only, they also provide an easy environment to explore your data using an array of data visualization options.
Create a new query:
- Name it
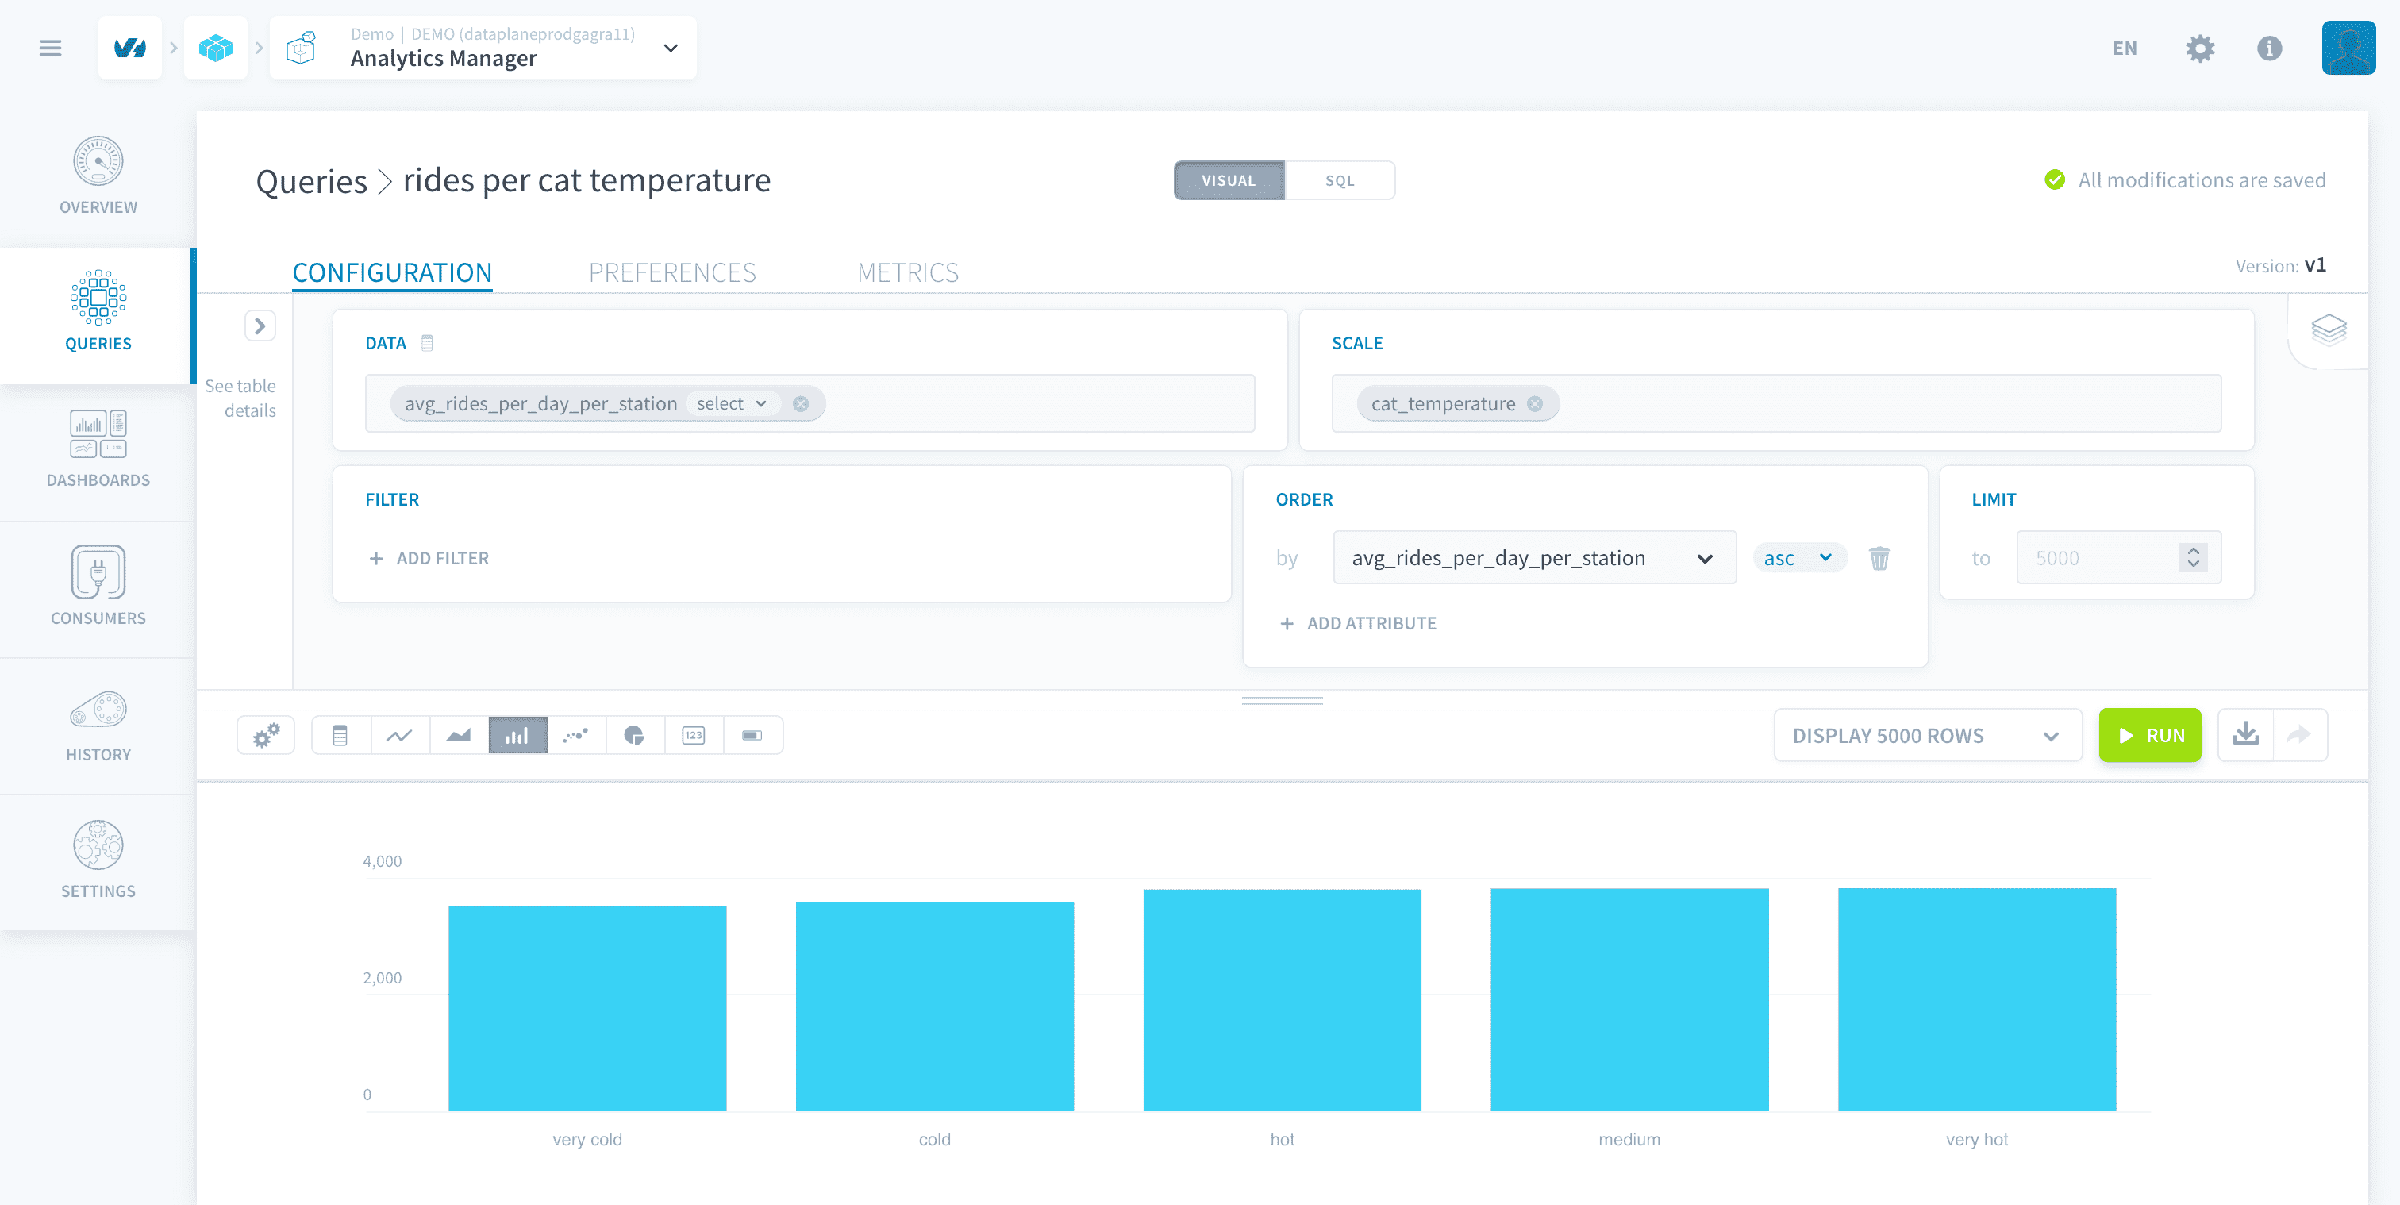
rides_per_cat_temperature. - Select avg_rides_per_day_per_station with compute mode select.
- Select cat_temperature as your scale.
- Select avg_rides_per_day_per_station as the Order (ascending order by default).
If you remember, avg_rides_per_day_per_station is a virtual attribute you have set in a previous step of the tutorial (Collect data). You cannot use any other compute mode than Select with this virtual attribute as it contains an SQL aggregate function. Adding Sum as compute mode would end up imbricating two SQL aggregate functions, resulting in an error.
Just like the screenshot below, click on bar chart icon to automatically display the data as a bar chart.
You have created two queries in the Analytics Manager. The next step is to expose that data through an API, which you will create and deploy for use in your application.
Expose your data by deploying an API
Go further
If you need training or technical assistance to implement our solutions, contact your sales representative or click on this link to get a quote and ask our Professional Services experts for a custom analysis of your project.
Ask questions, give your feedback and interact directly with the team building the Data Platform on the dedicated Discord channel.
If you need support with your OVHcloud services, create a request in our Help Centre.
Join our community of users.