

Query and export job logs with the Logs Explorer
The Logs Explorer is a comprehensive tool to query and export logs from job executions and live deployments on the Data Platform
Objective
The Logs Explorer is a comprehensive tool to query and export logs from job executions and live deployments on the Data Platform.
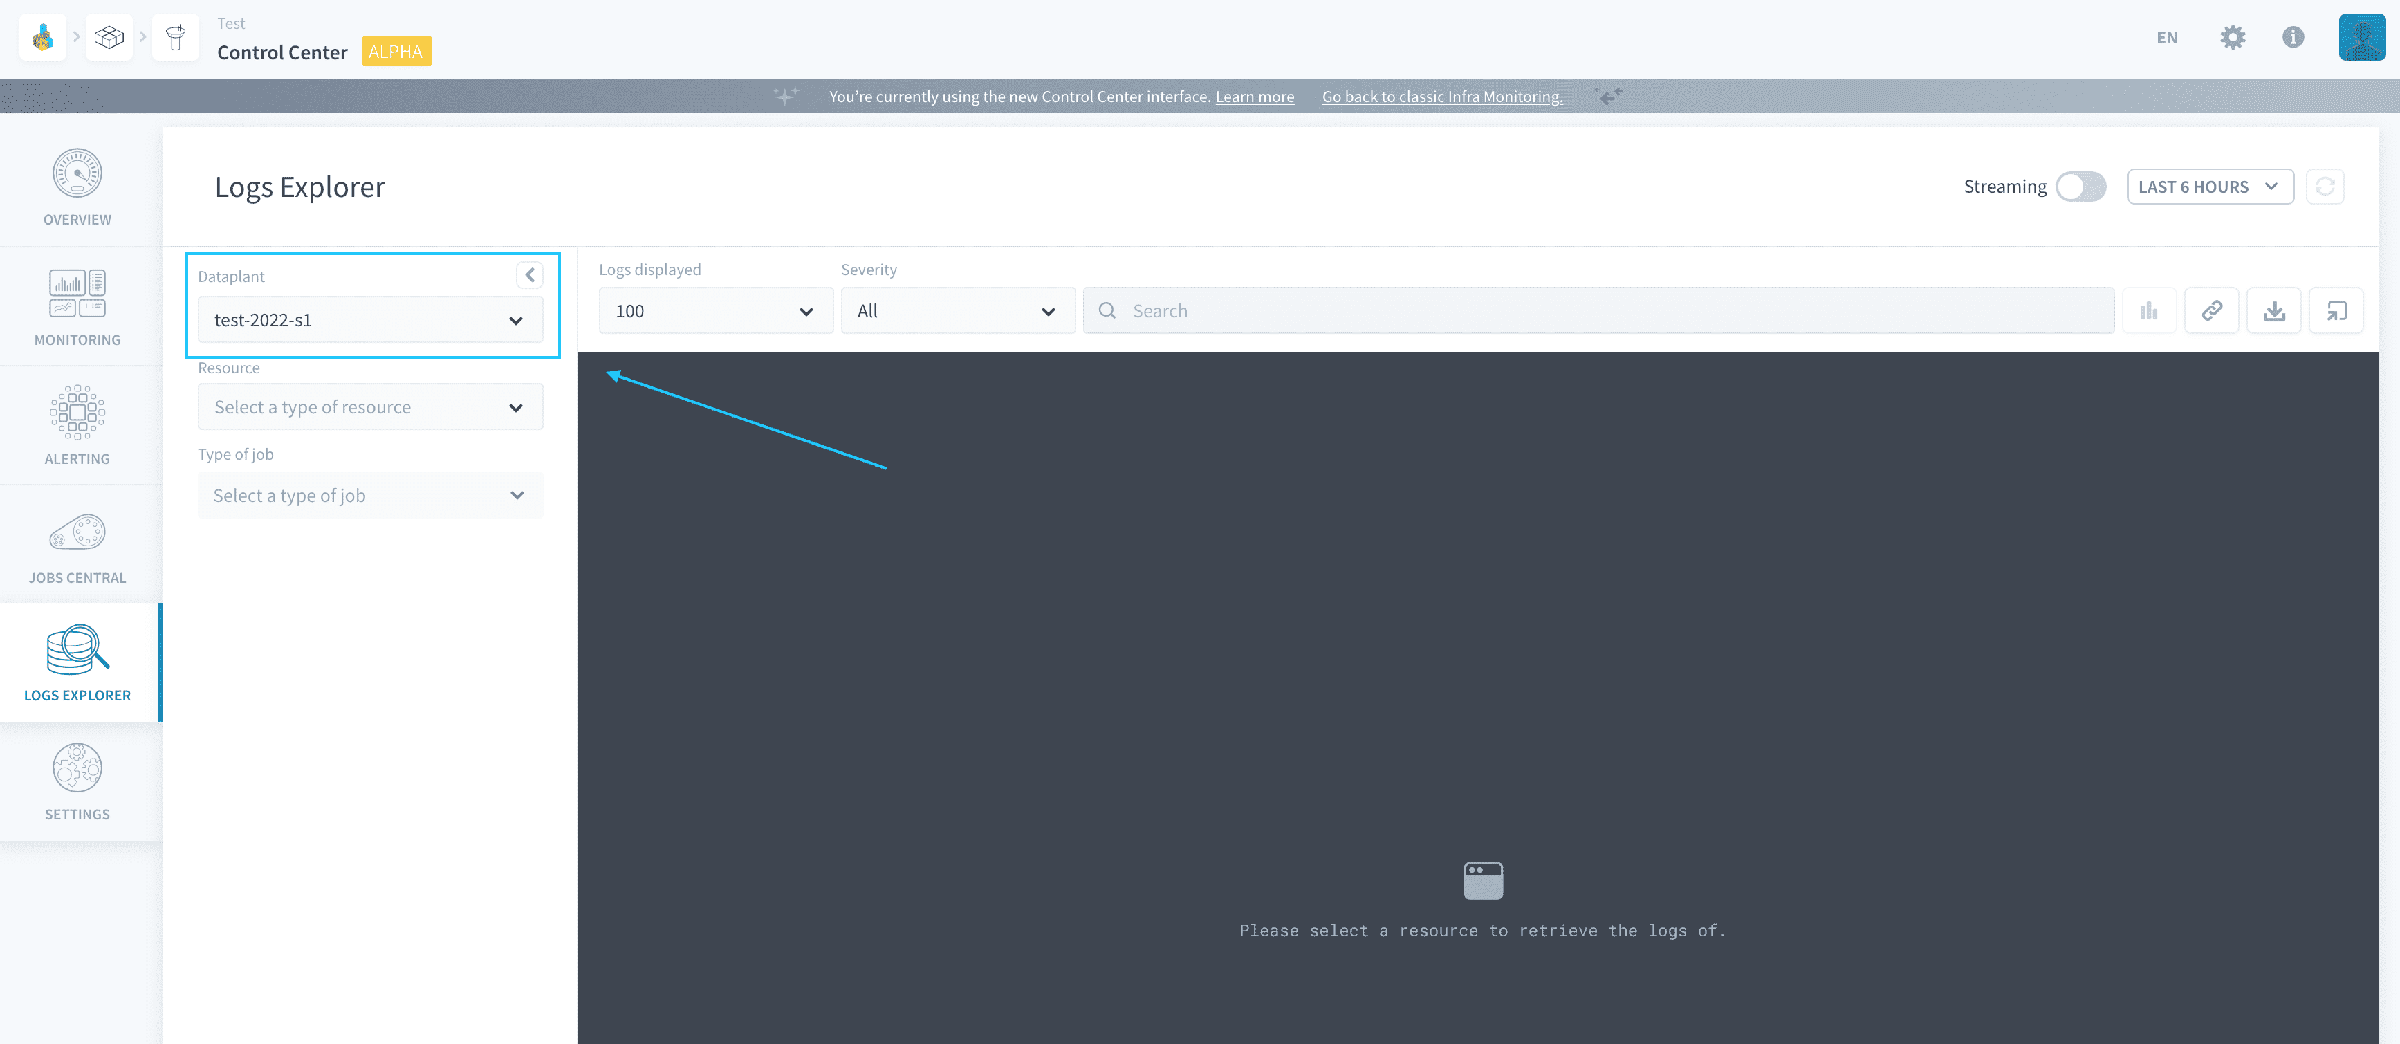
Like all subcomponents in the Control Center, the Logs Explorer can be opened at the level of the organization. However, logs exploration will only be possible inside a specific Project. If the Logs Explorer is opened at the level of one Project, then this field cannot be edited.
Get logs
Get logs of past job executions
The Logs Explorer allows you to check the logs of:
- Data Processing Engine actions job executions
- Data Processing Engine workflows job executions
- Connectors metadata extract jobs
- Lakehouse Manager physical build jobs
Choose Jobs as the Resource on the left column.
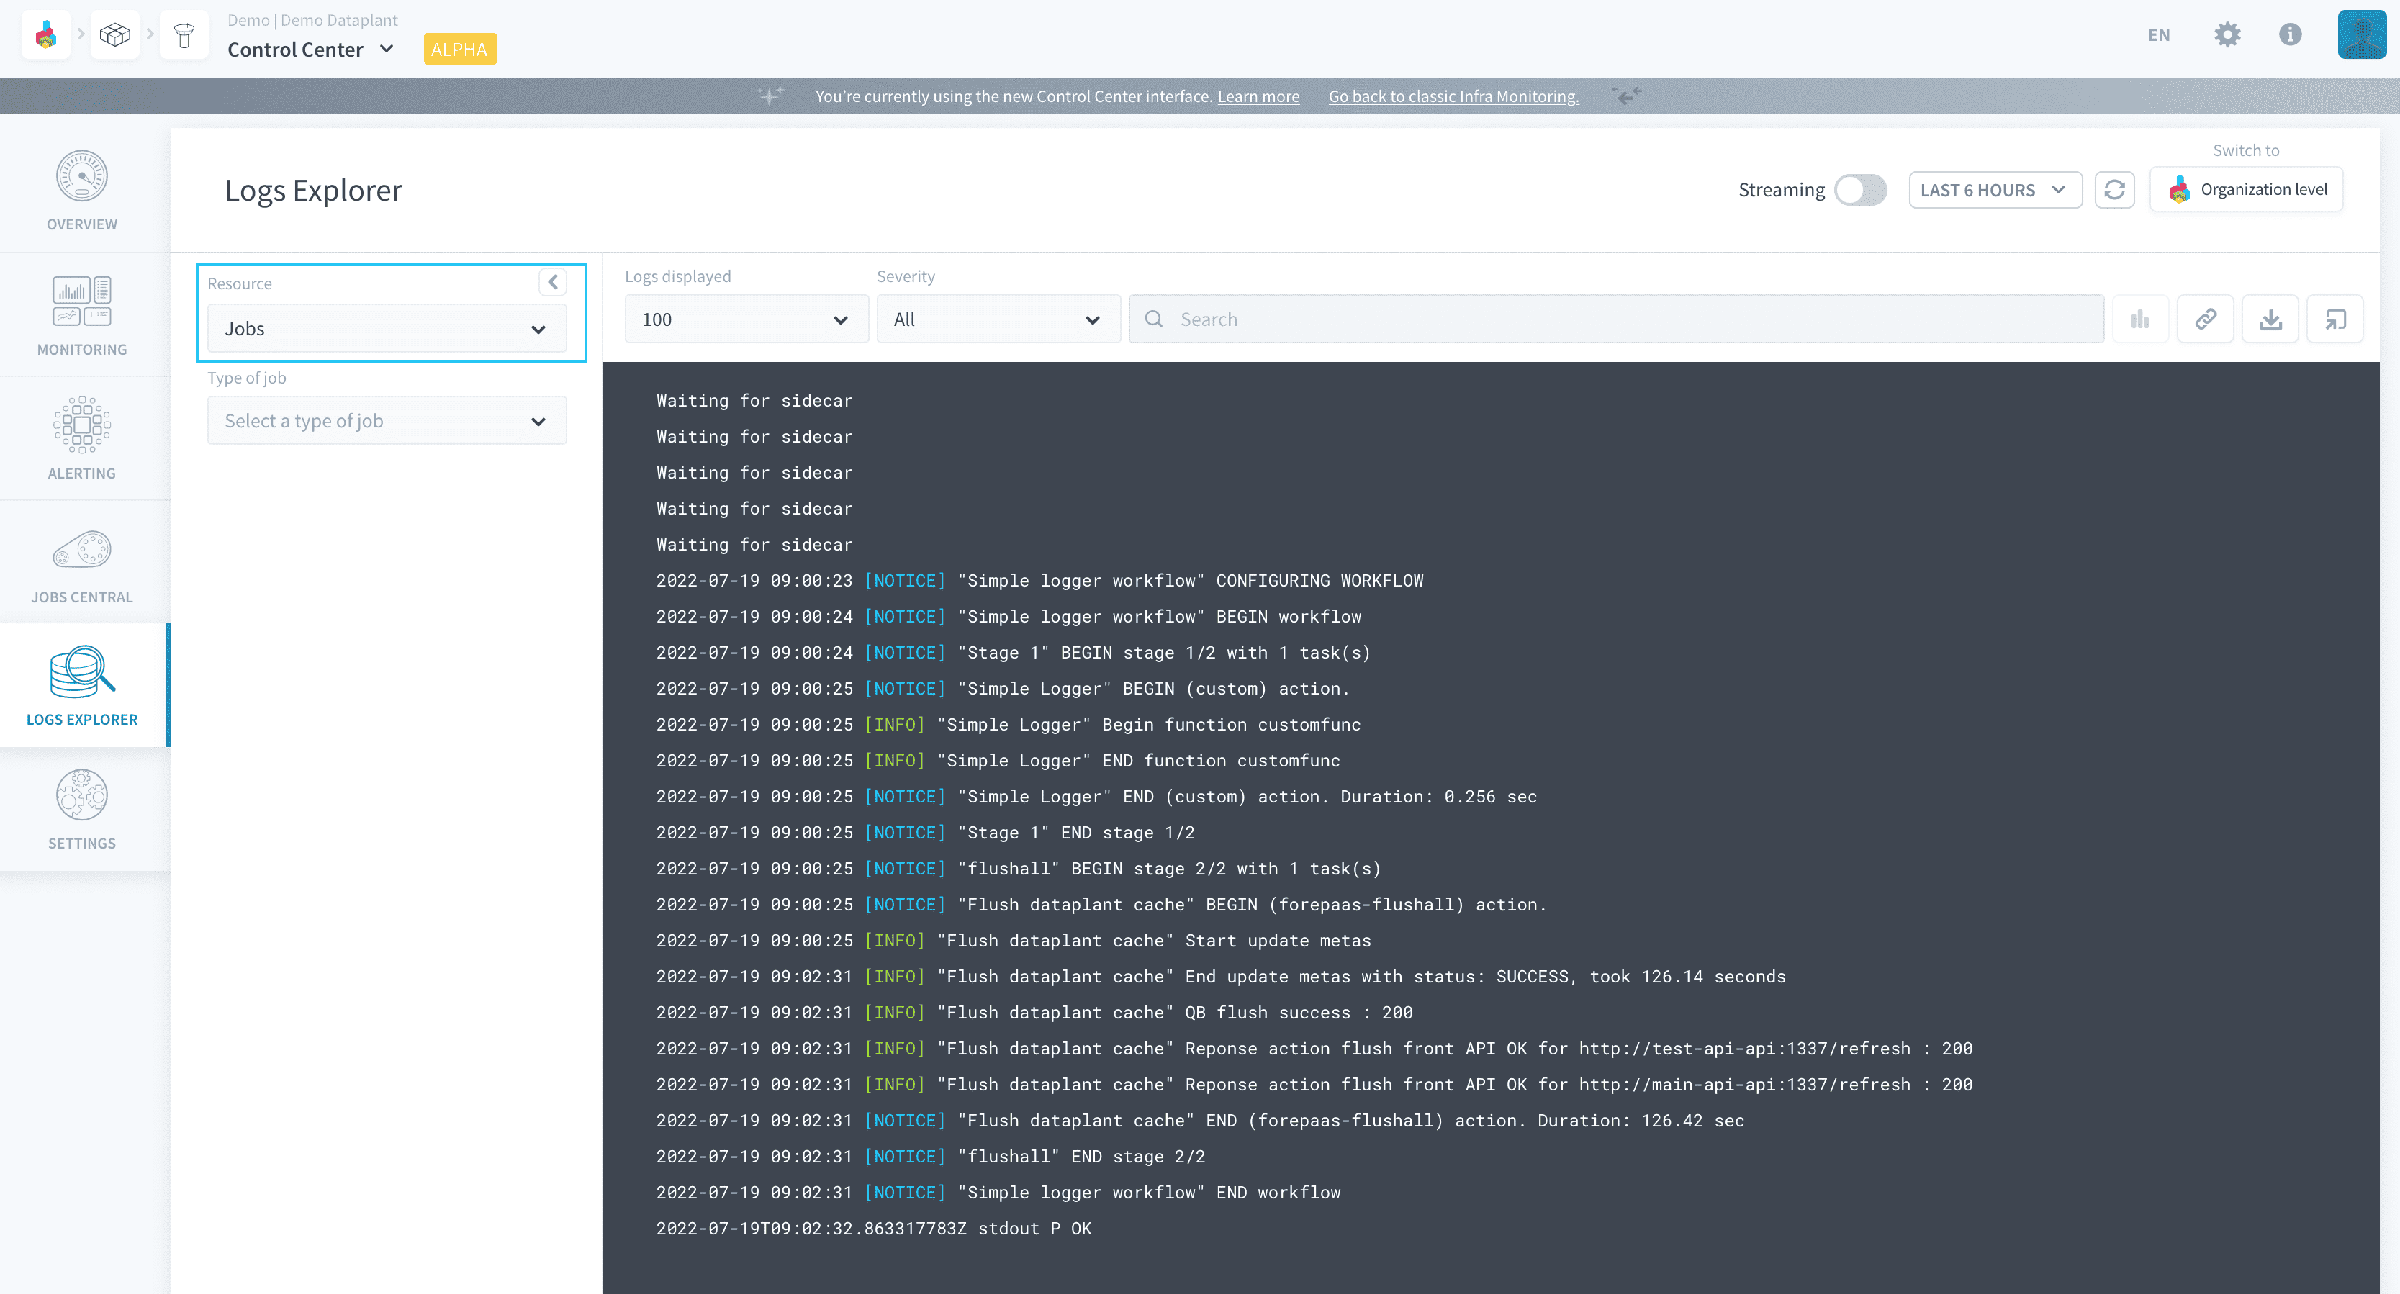
Choose the type of jobs to explore.

By default, the Logs Explorer will display the logs for all jobs matching this type. You can drill-down on a specific object in the bottom left list - ranked by number of executions.
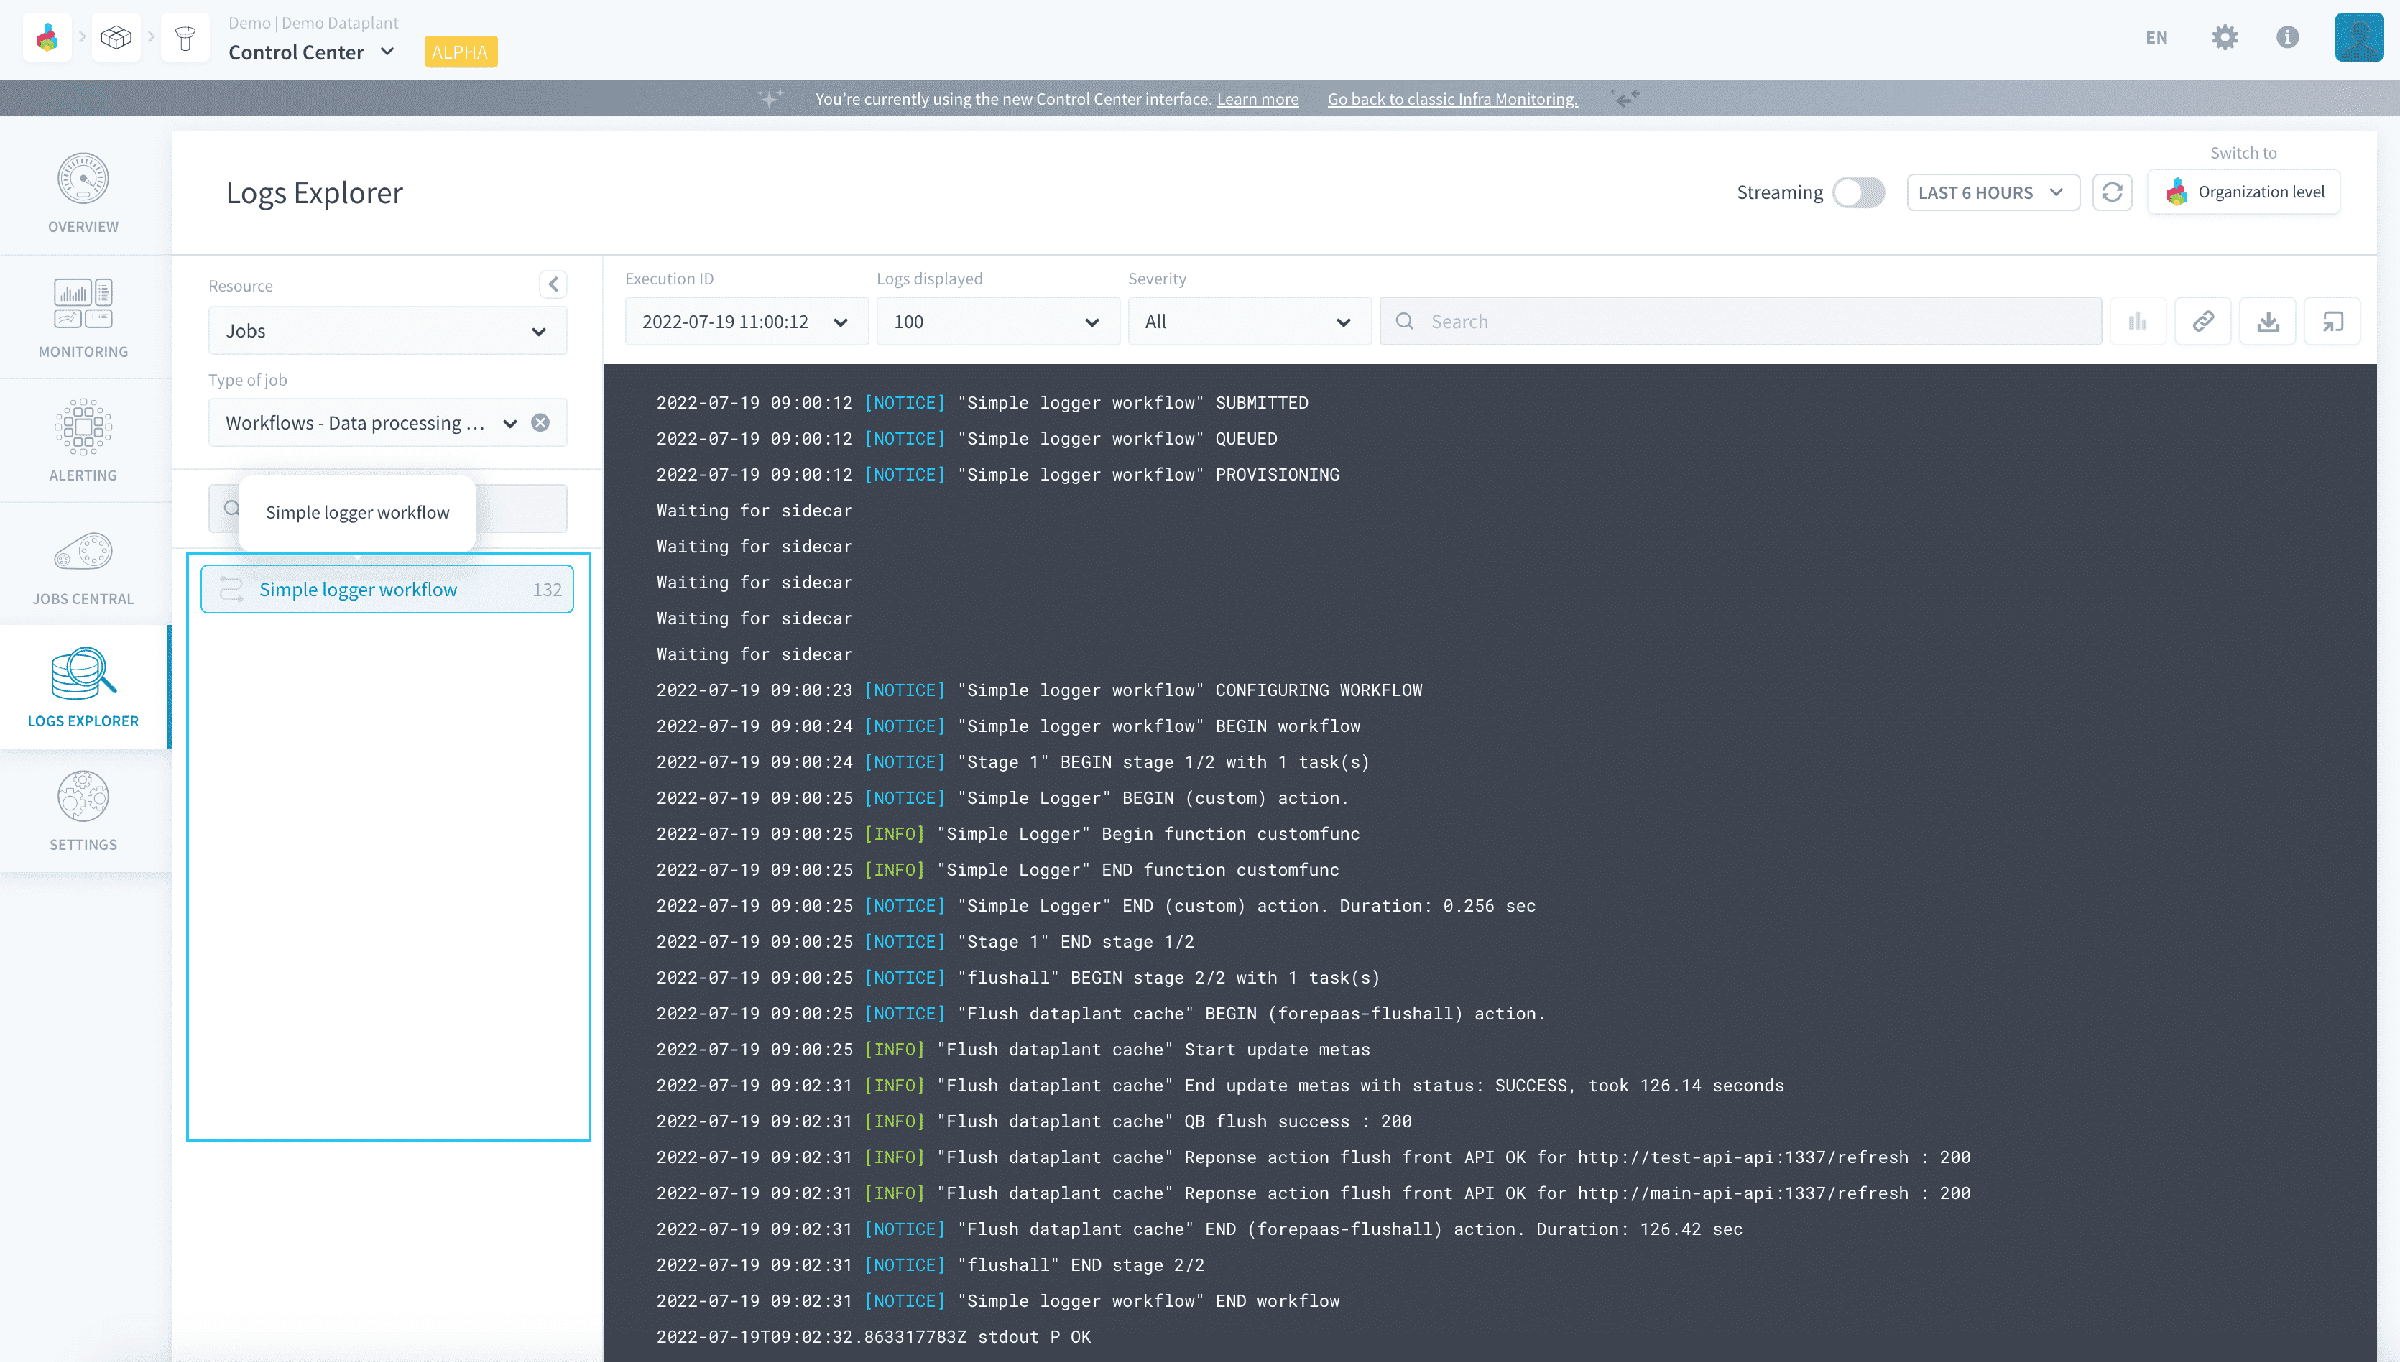
You can drill-down further by filtering on a specific execution ID or a specific time-range above the display.
Make sure that the execution that you want to display is contained in the time-range that you are filtered on.
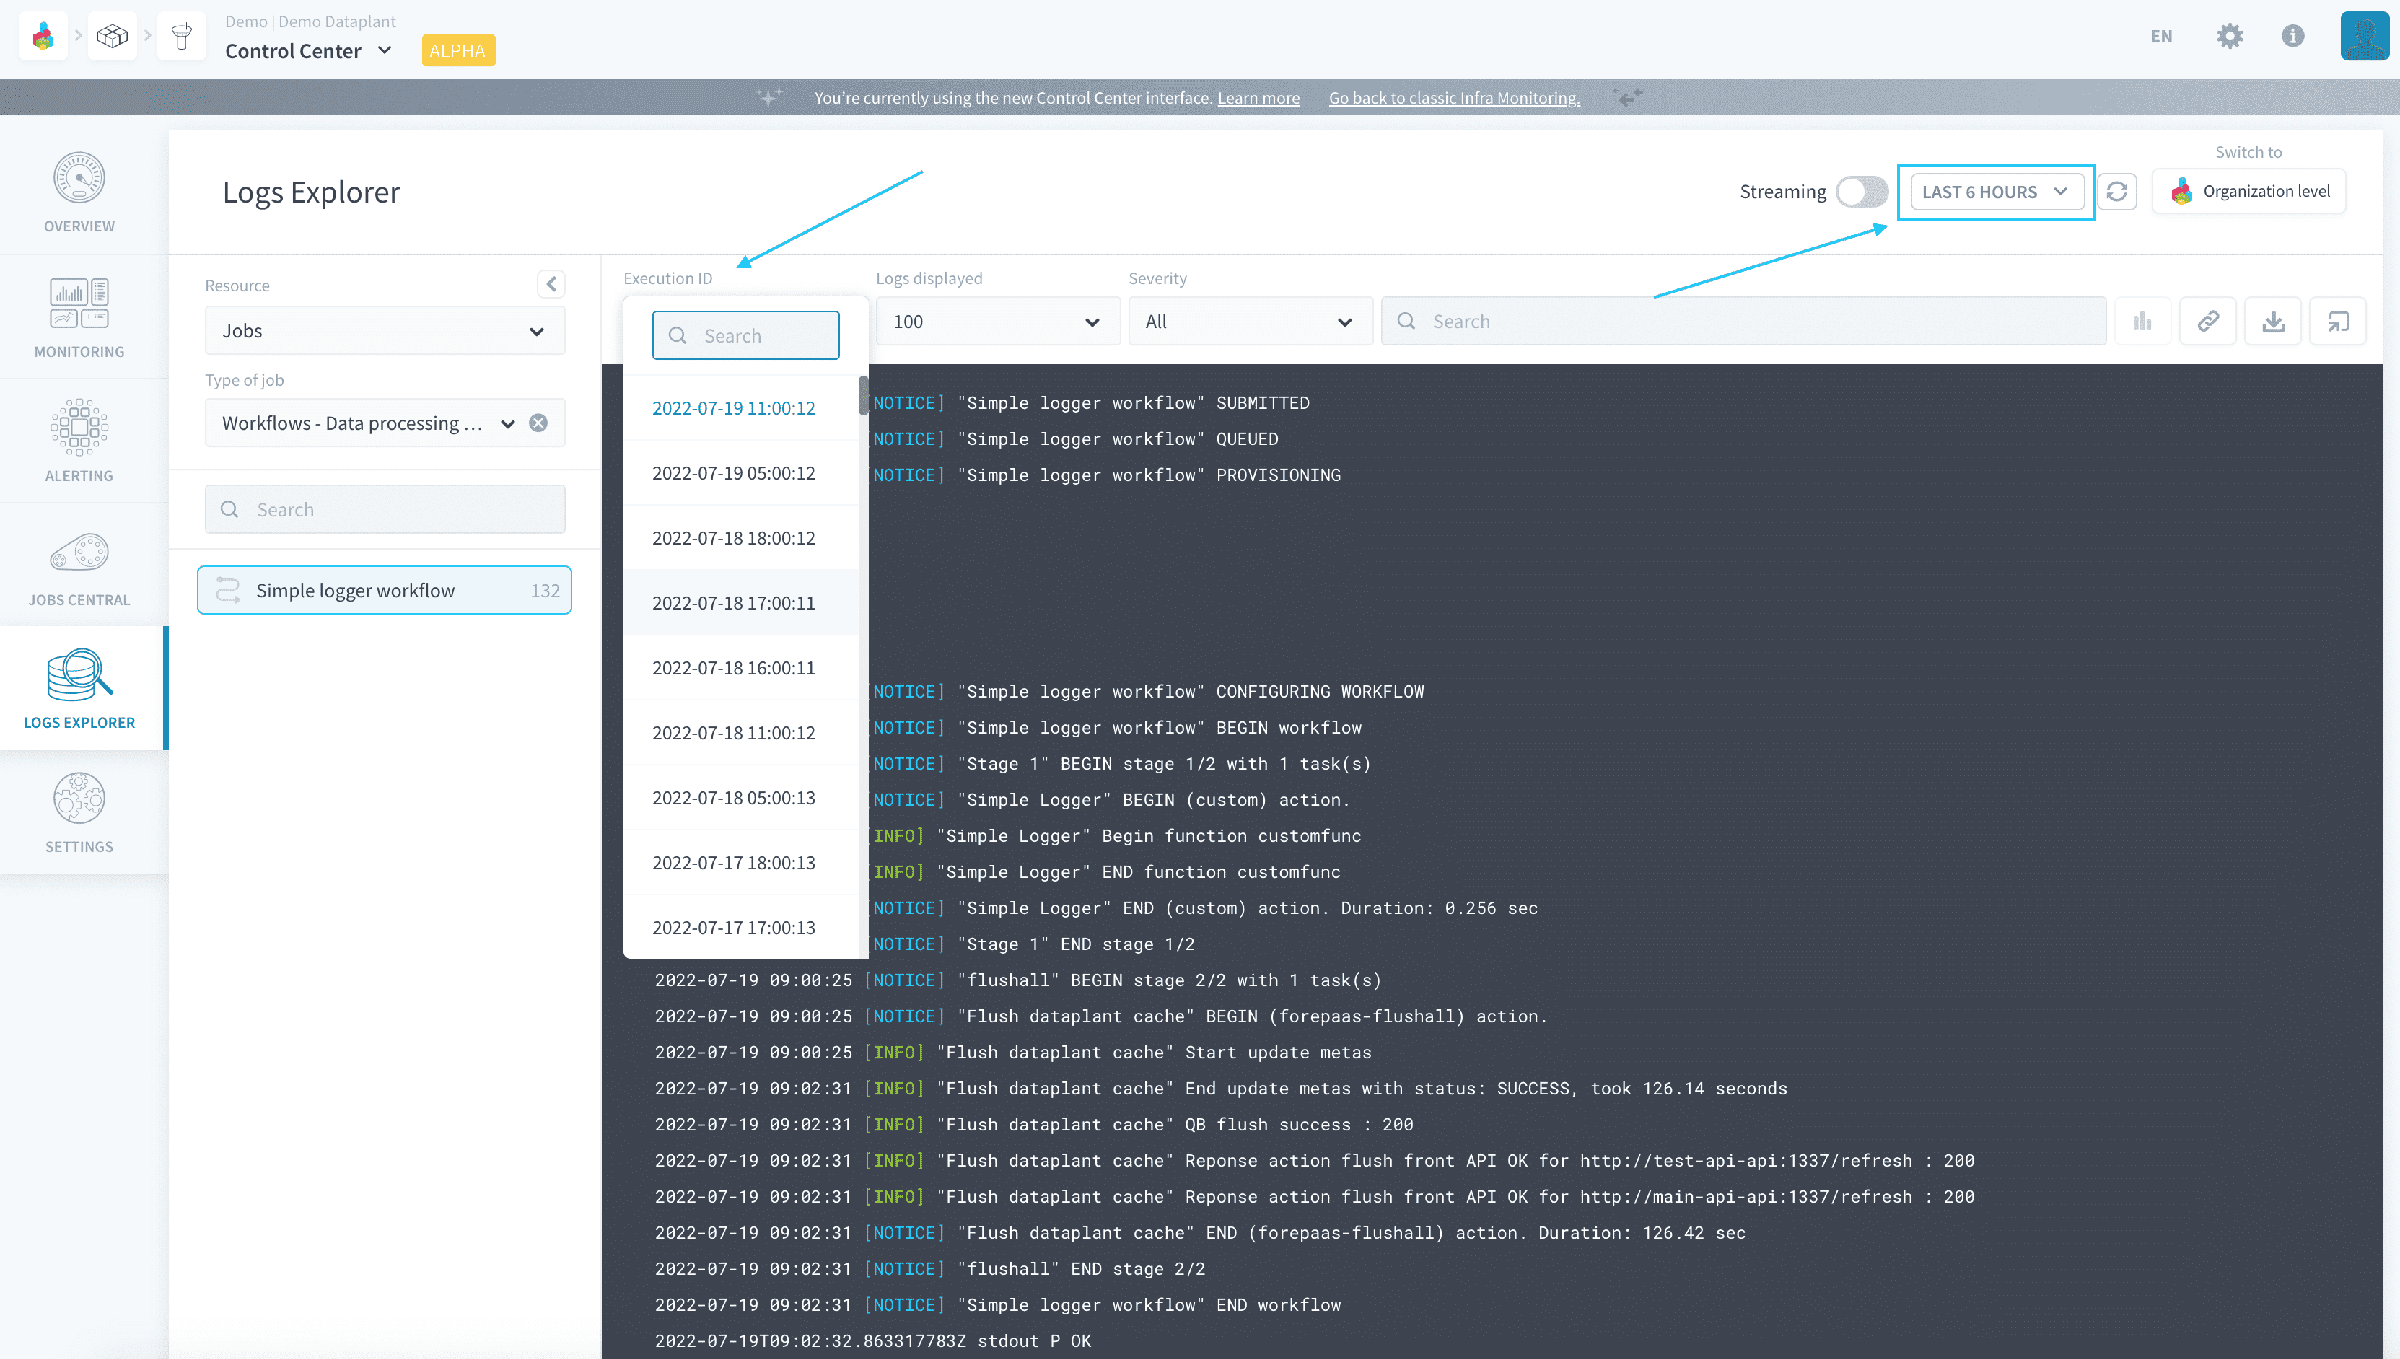
Note that logs will be queried by successive batches of at most 250 logs. Scroll down in the console to load more logs.
Get logs of deployments
The Logs Explorer also allows you to check the logs of:
- APIs
- Applications
- Notebooks
- Always-up deployments in the Data Processing Engine
- The App Service component: an infrastructure service to control APIs and apps
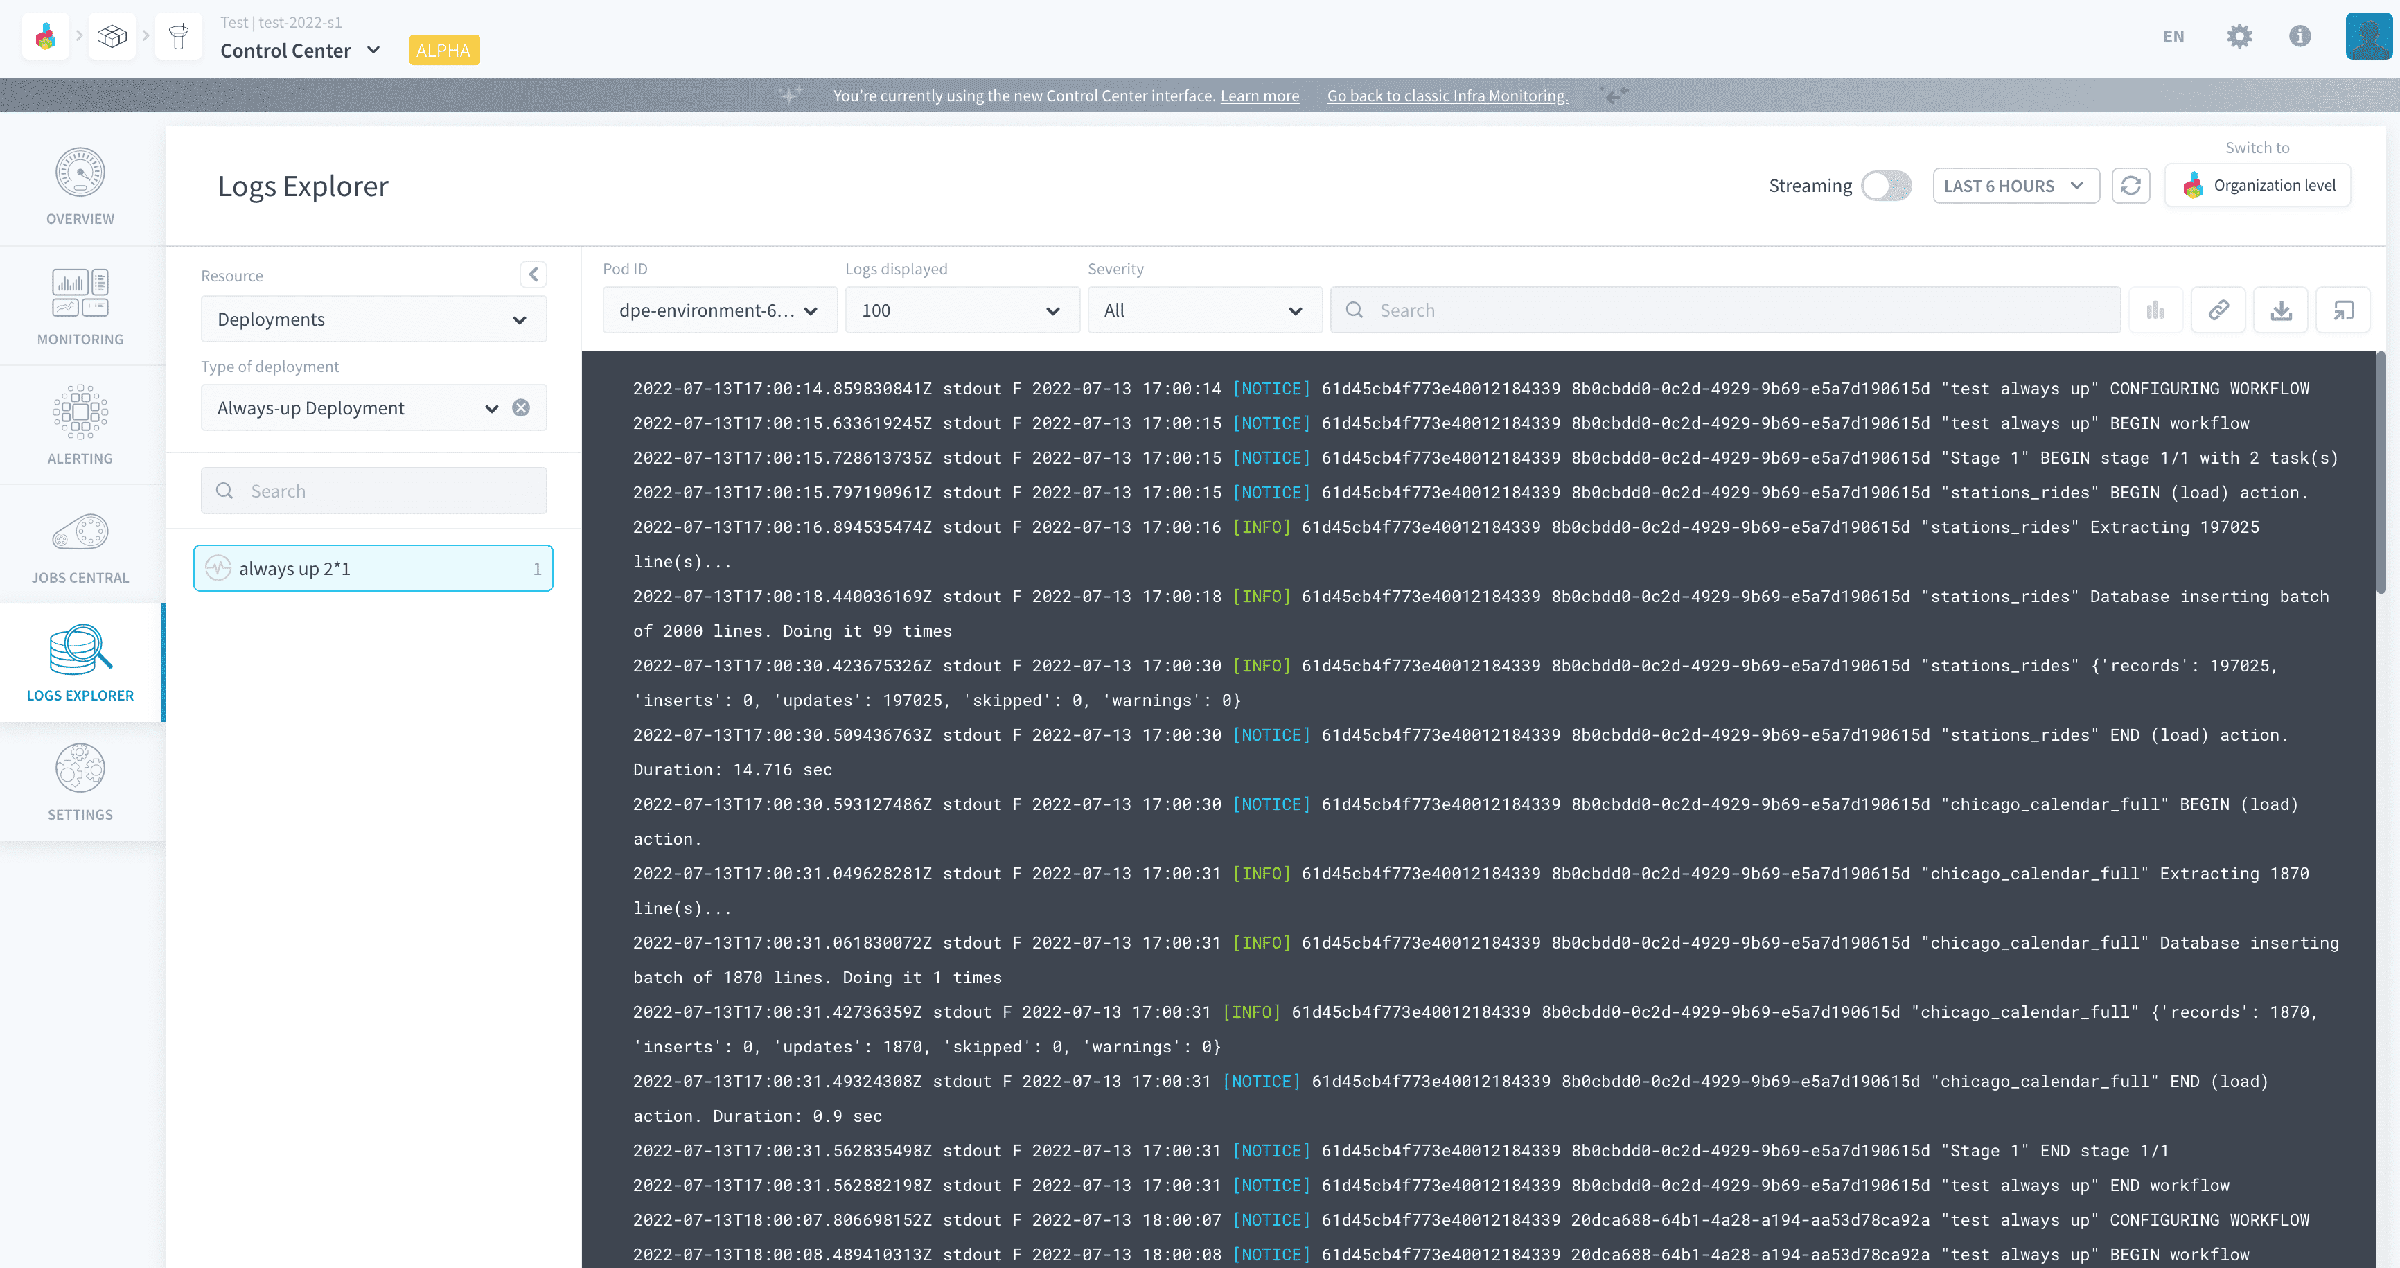
Choose Deployments as the Resource on the left column.
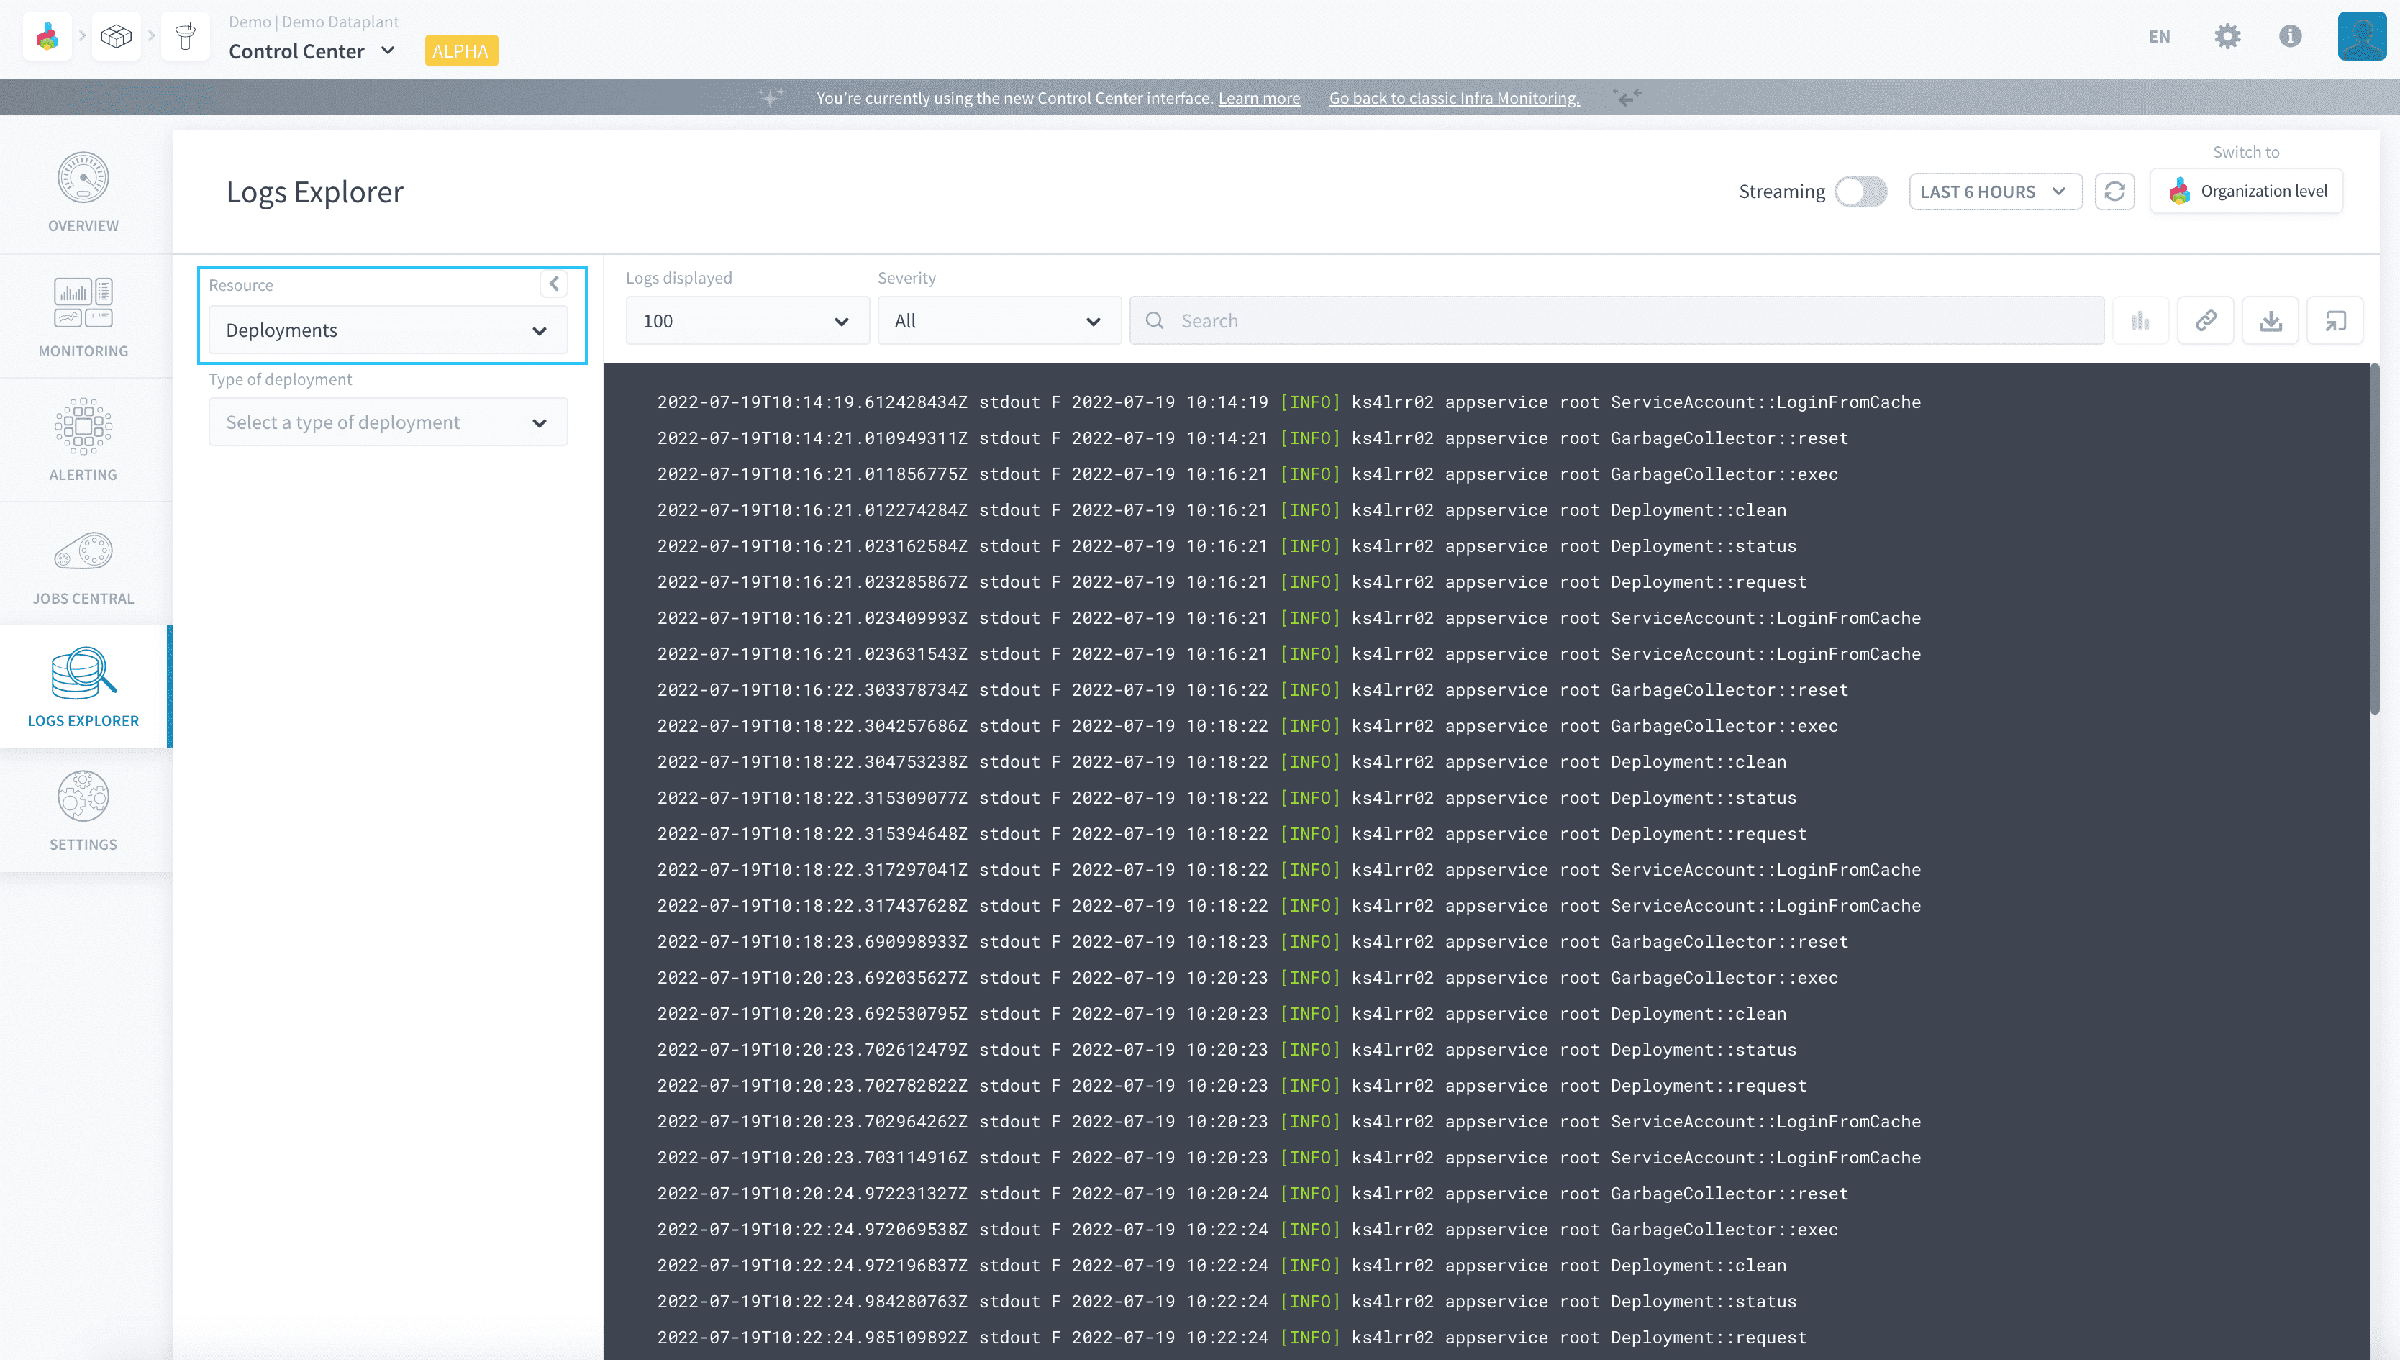
Choose the type of deployment to explore.

By default, the Logs Explorer will display the logs for all deployments matching this type. You can drill-down on a specific object in the bottom left list - ranked by number of active workers. By default, the logs of all workers for that deployed object are aggregated altogether in the display.
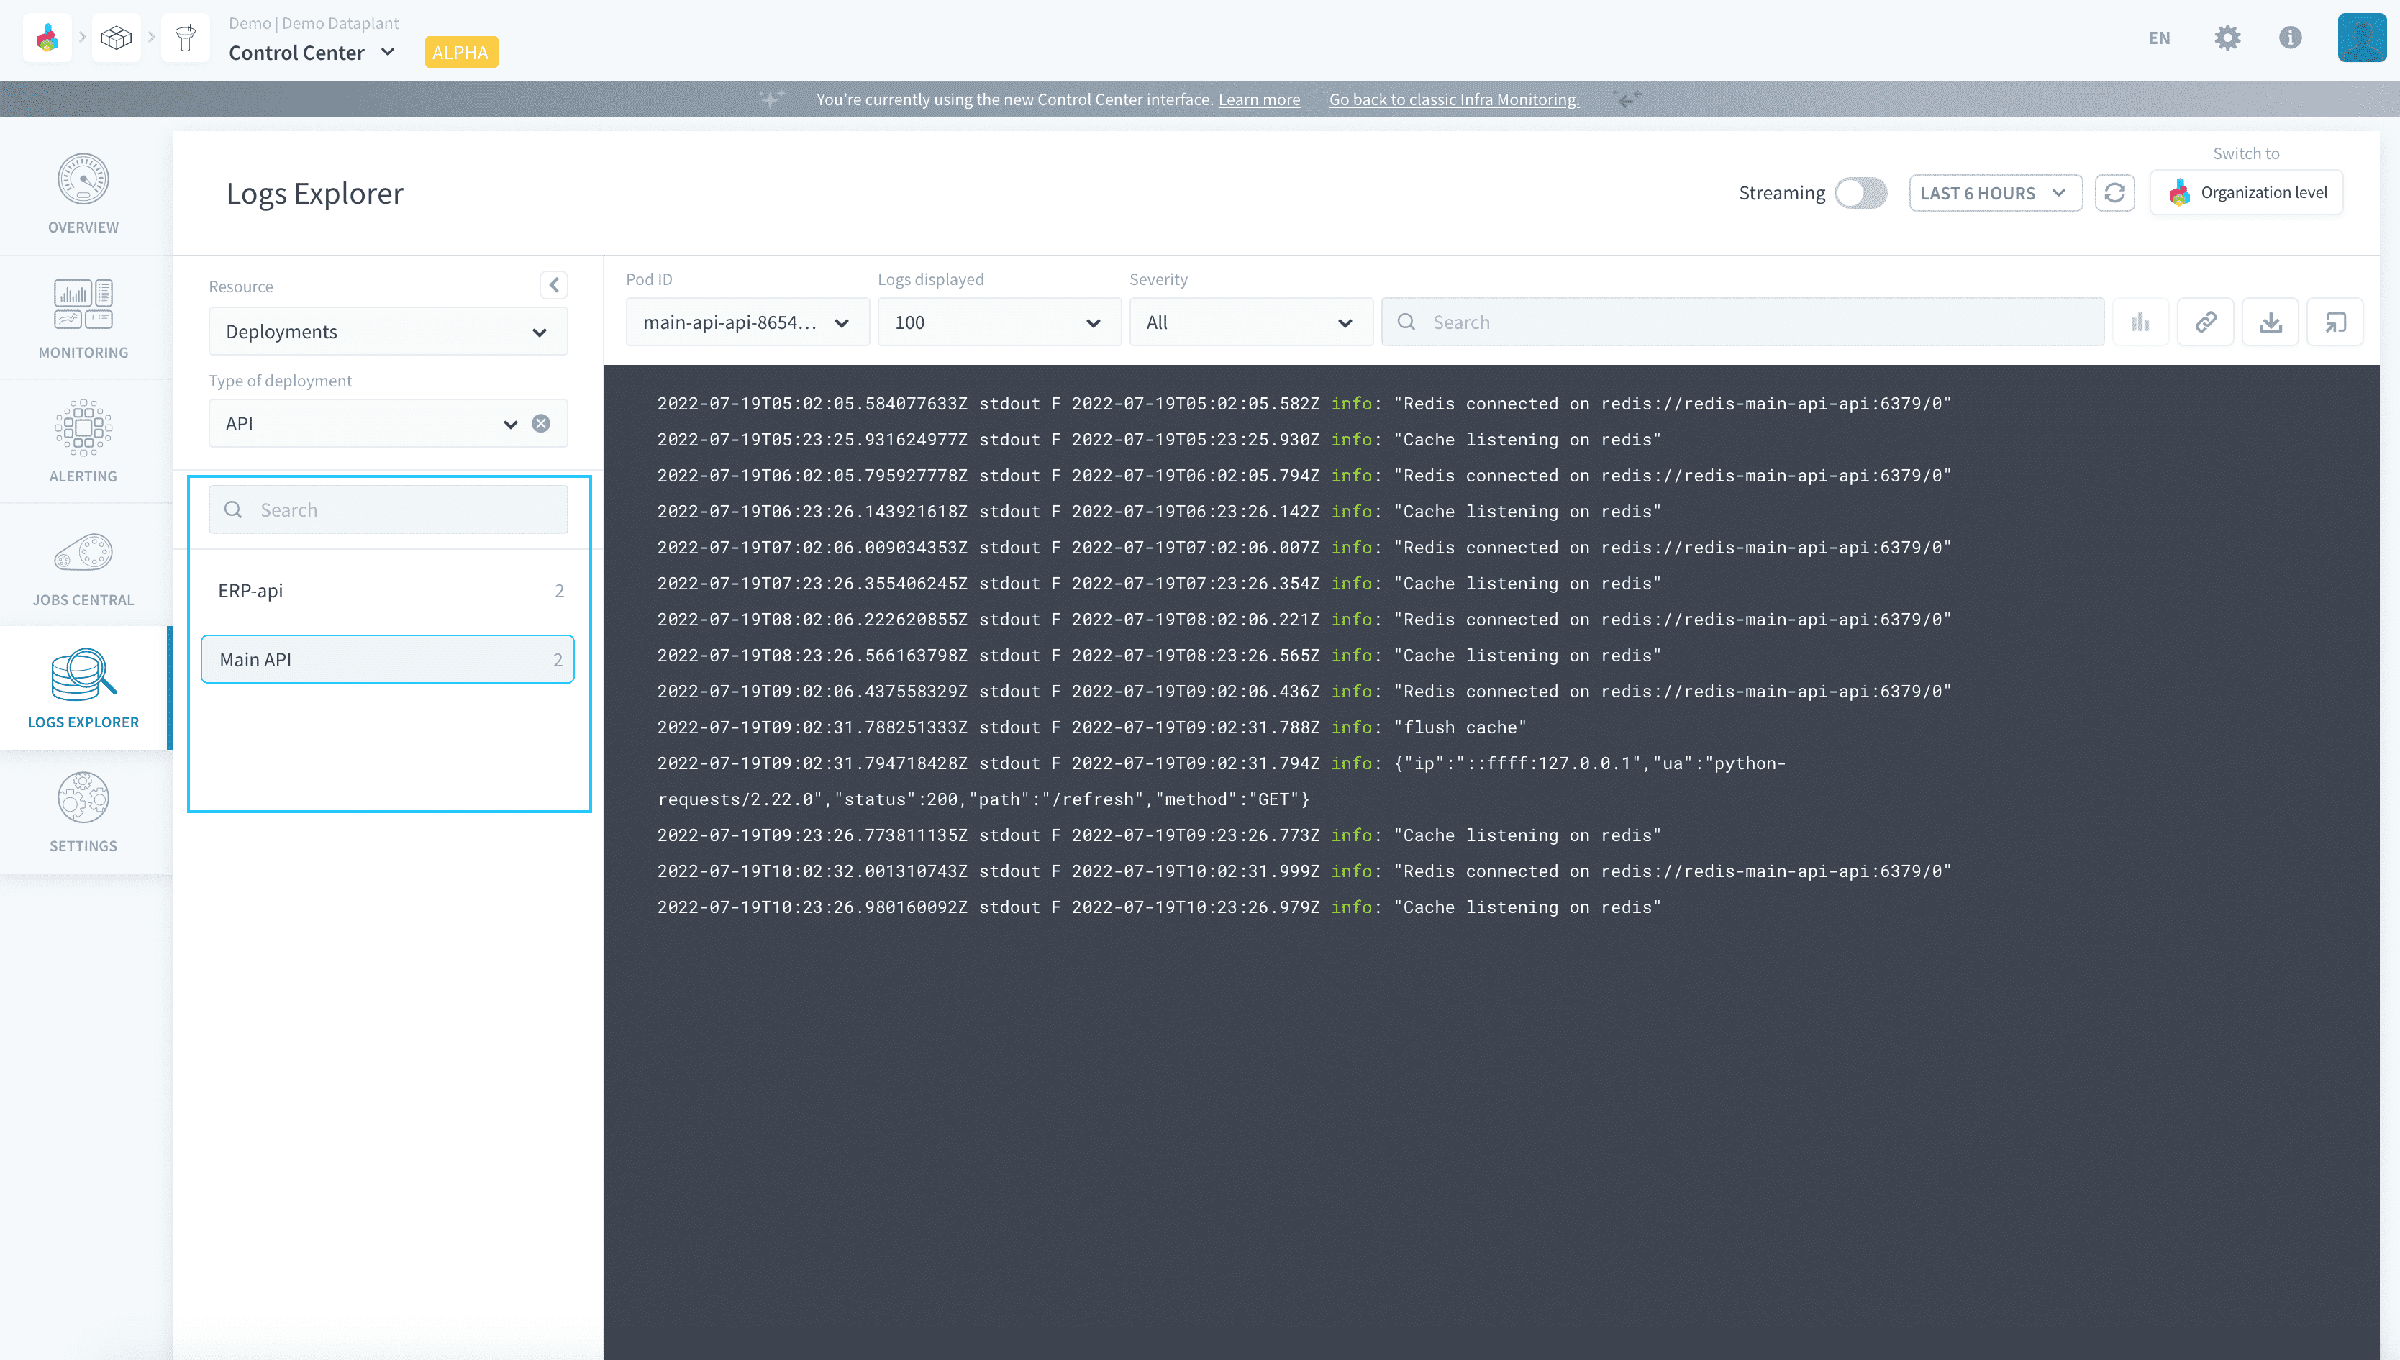
You can drill-down further by filtering on a specific worker ID or a specific time-range above the display.
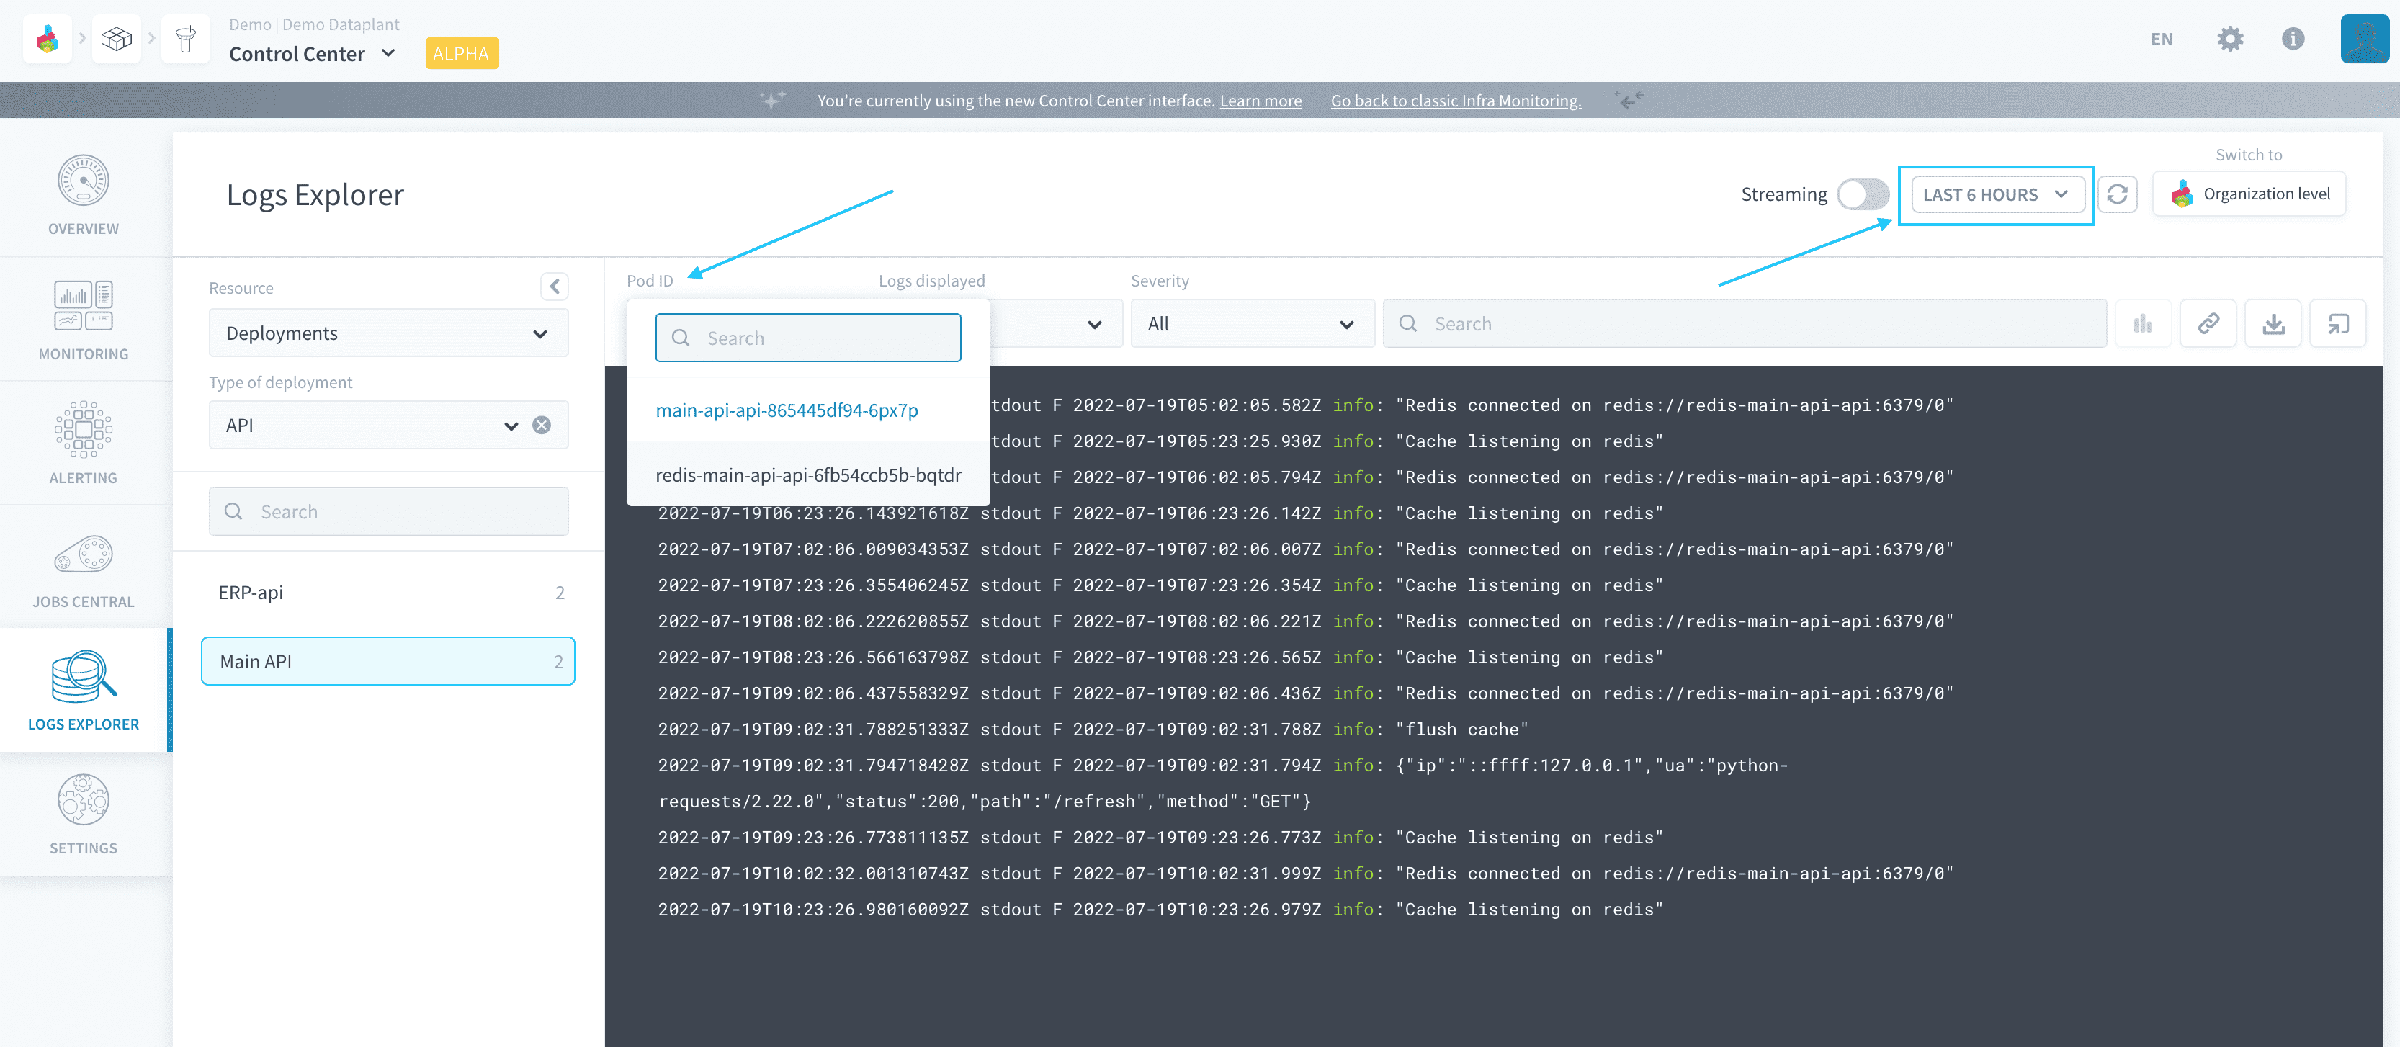
Note that logs will be queried by successive batches of at most 250 logs. Scroll down in the console to load more logs.
Use the streaming mode
By default, the Logs Explorer must be refreshed manually to display new logs.
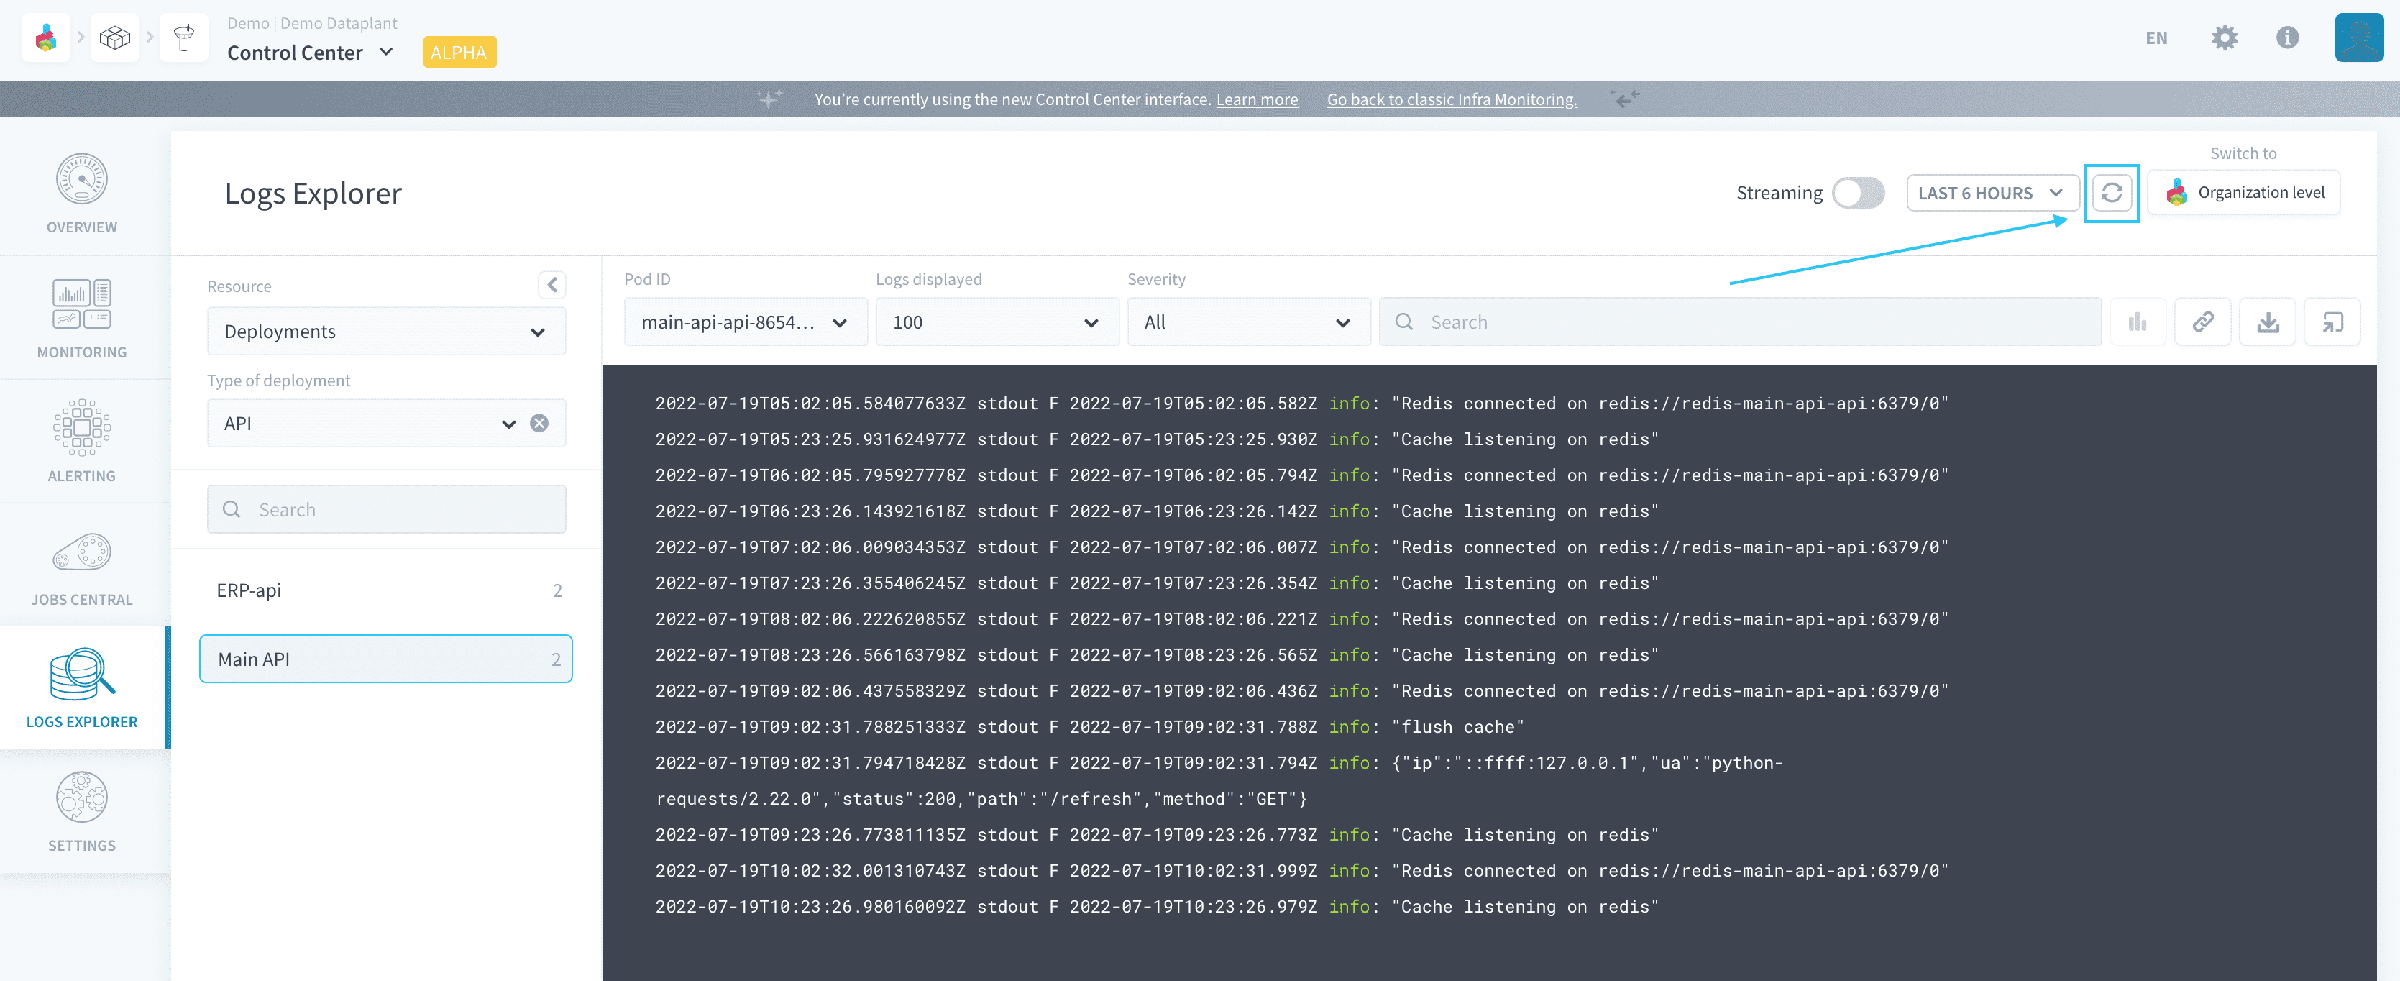
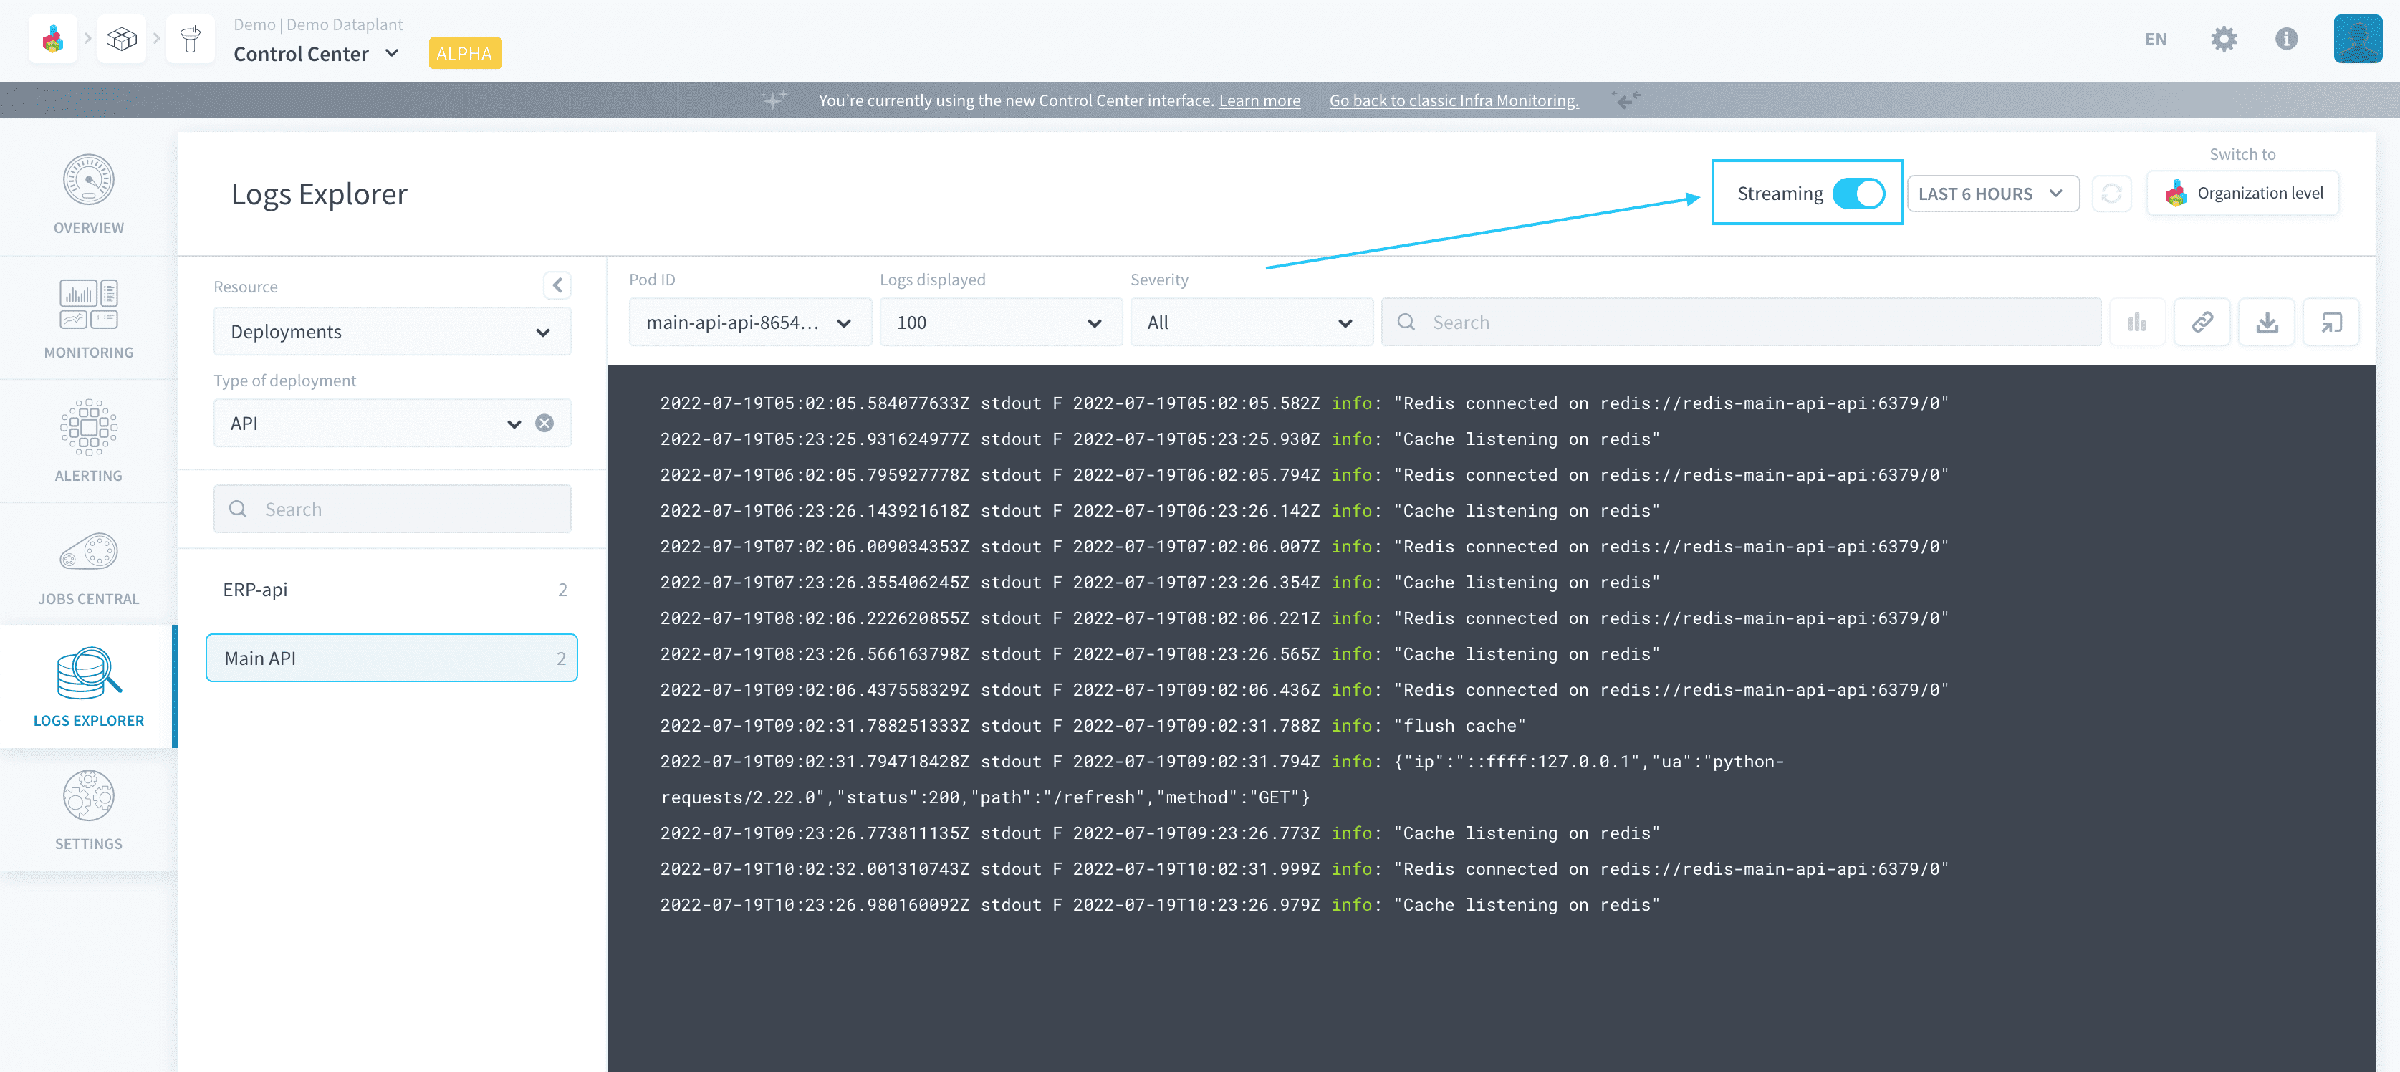
Activate the streaming mode to receive the latest logs in real time.
Filter logs
Search in logs
To filter down your log result, it is possible to either search for an exact substring or to match to a regular expression (Regex) using the search bar above the console. Searching something in the searchbar will run a new log query on the whole timeframe and return the logs matching the search filters.
By default, simply typing text in the searchbar will search for all logs containing this substring, ignoring lowercase/capital letters.
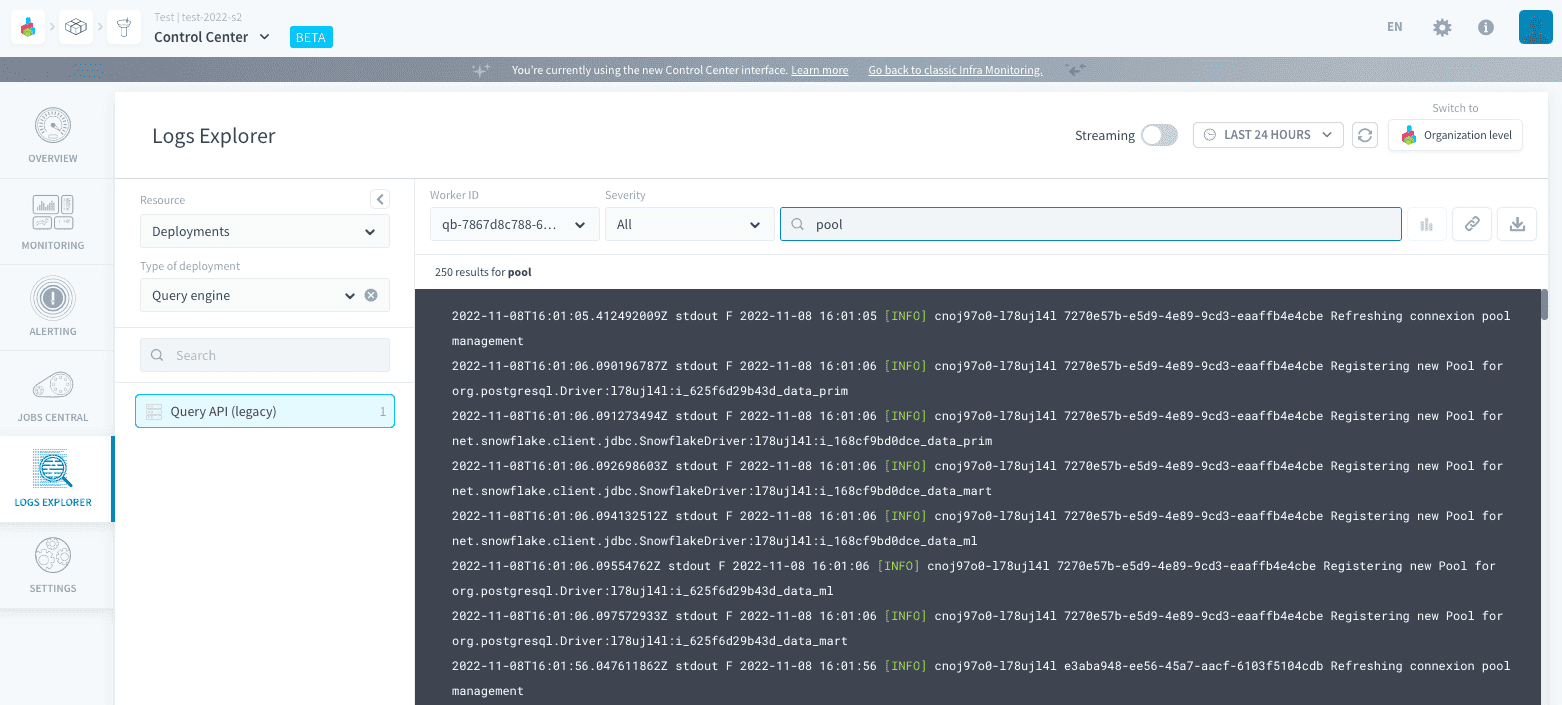
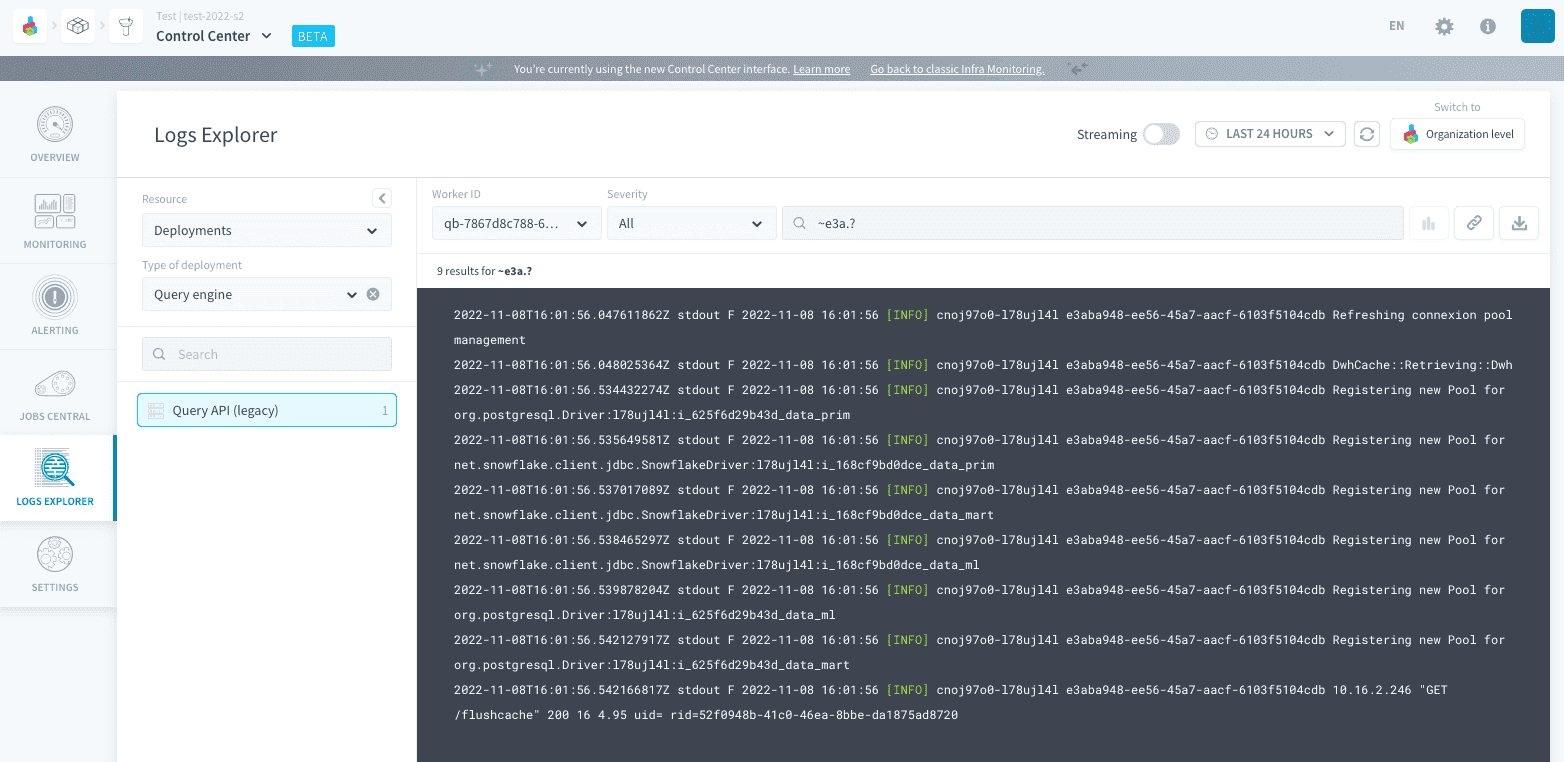
Alternatively, it is possible to start your search with any of the following operators:
=followed by text: search for all logs containing this substring (case sensitive)!=followed by text: search for all logs not containing this substring (case sensitive)~followed by a regex: search for all logs matching the regular expression!~followed by a regex: search for all logs that don't match the regular expression
Severity
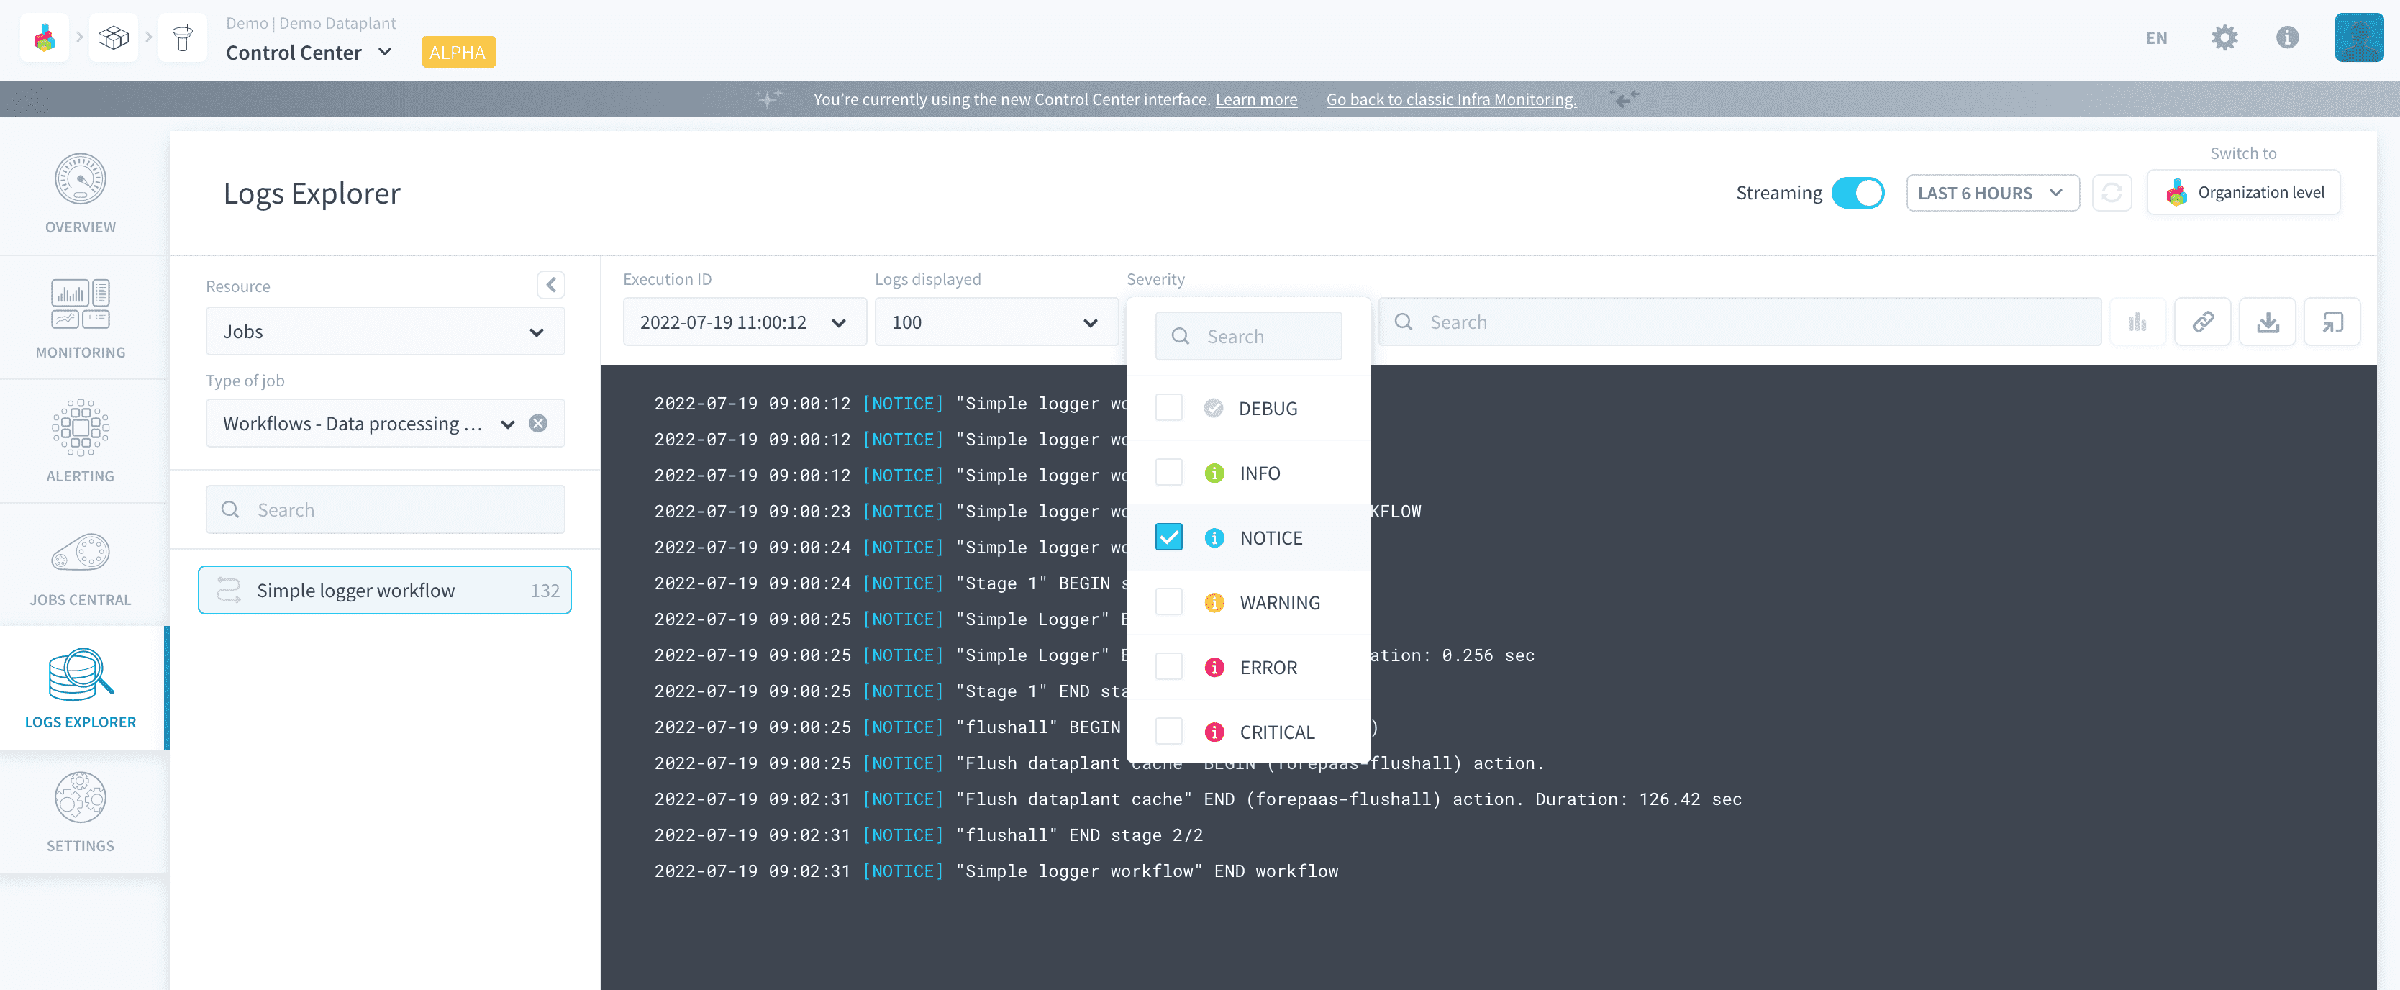
Logs have different level of severity - ranged from INFO to CRITICAL - to filter on.
If you don't see all the levels that you should be seeing, make sure your jobs are configured to export the correct level of logs.
Timestamp
As mentioned above, logs are all associated to a specific timestamp, so they can be filtered on a time-range. For jobs execution logs, it is also possible to filter on one specific execution.
Share logs
Logs can be shared in one of two ways: by sharing the link to the Logs Explorer or by exporting a text file containing the logs.
Share an Explorer link
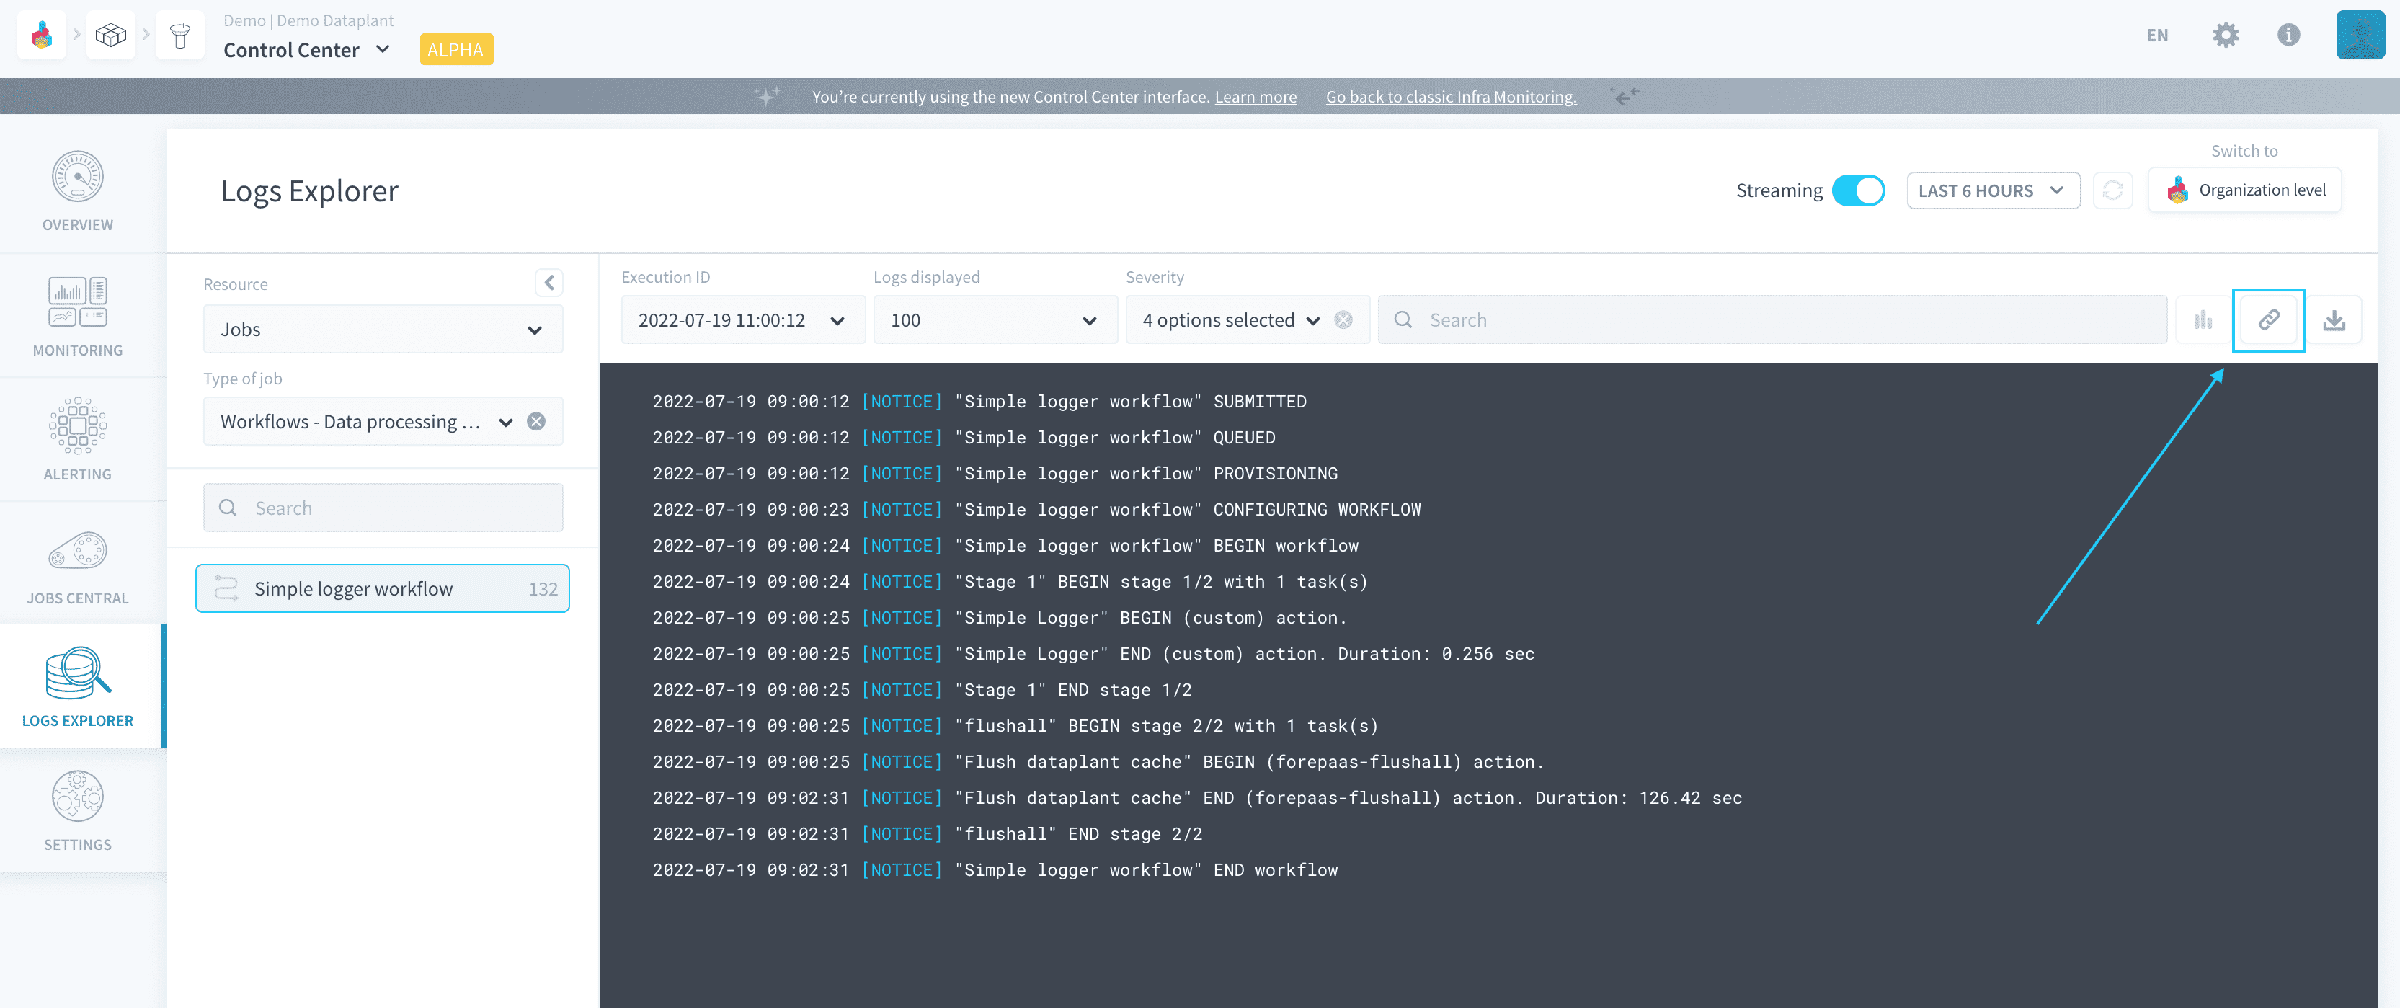
Click on the link icon to get a link for the page with the current filter configuration.
Export a log file
Click on the export icon to download a .log file containing the logs currently displayed in the UI.
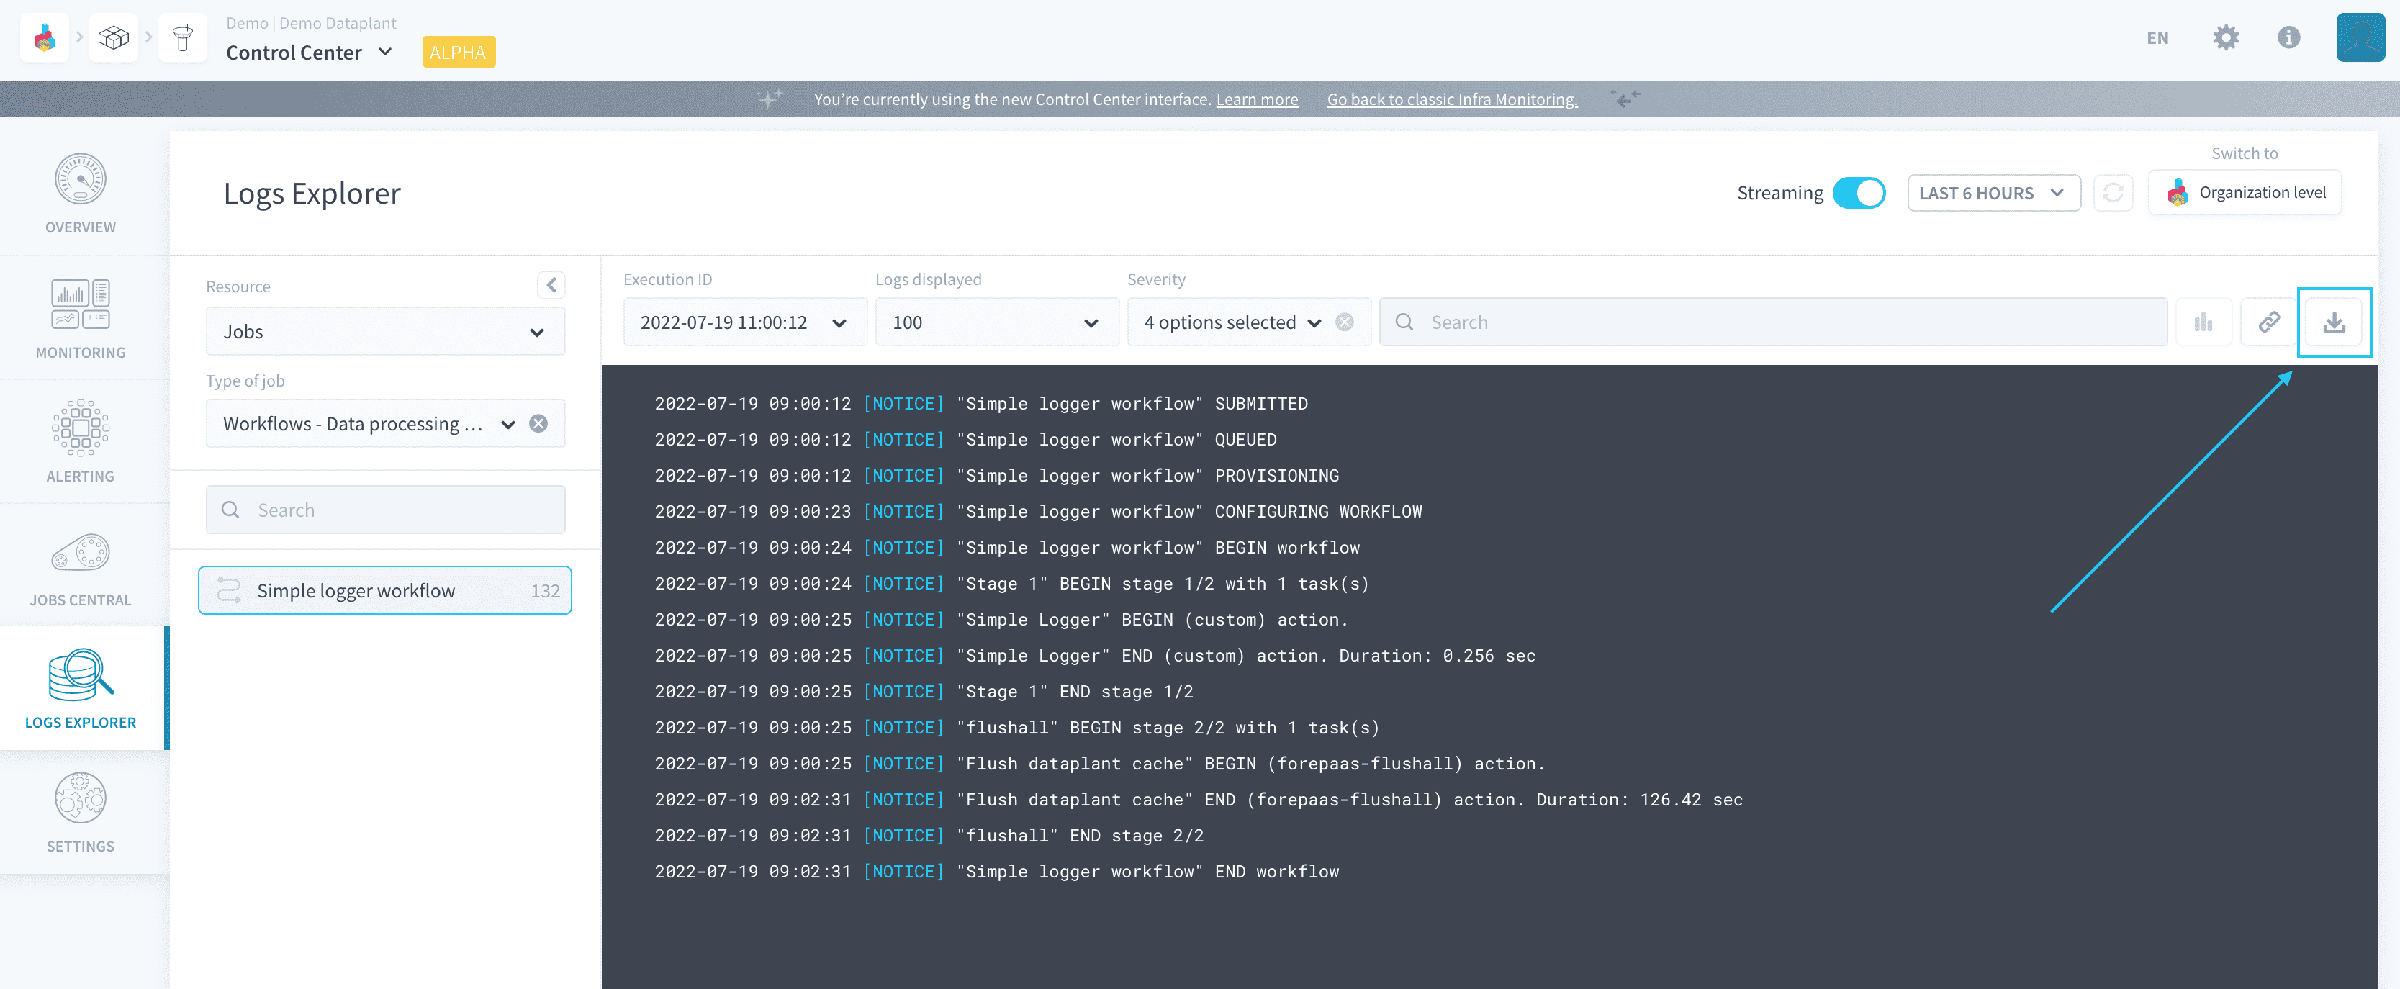
Share those log files to the Data Platform Support team whenever you need help debugging a Project on Data Platform.
Go further
If you need training or technical assistance to implement our solutions, contact your sales representative or click on this link to get a quote and ask our Professional Services experts for a custom analysis of your project.
Ask questions, give your feedback and interact directly with the team building the Data Platform on the dedicated Discord channel.
If you need support with your OVHcloud services, create a request in our Help Centre.
Join our community of users.