

Chart templates
Rework pending, no delivery date. The Front App SDK (ReactJS) and the Front API SDK (NodeJS) are both being replaced. This page documents the current release, remains accurate, and is maintained until the replacement ships. Code written against it keeps working.
Style templates can be applied to your favorite chart libraries to automatically setup the configuration for every chart you want to look the same. You can use style templates in a simple way, either from Architect (ForePaaS' dashboard creation tools) or locally on your machine.
Why use style templates?
Here is a chart configuration structure. Please see this documentation page for more details on charts.
You can pass props to your charts using the options object.
For example, if you want to define a bar chart with Recharts, with a barGap of 3, a barSize of 6 and a specific margin, you can pass the following options:
Things can get complicated if you want all your bar charts to have the same configuration controllable outside of the individual chart widgets, without having to repeat the setup for every chart.
ForePaaS offers a simple solution to do that: create style templates for your configurations.
Step 1: Create Templates
Everything will happen in the config/templates.json file. This is where you define all your templates.
A template is defined like this:
To use the example above, this would translate as follows:
Defining the template name
The templateName can be used in 2 ways:
1. Using the name of an existing component
The options will apply to all components of this type.
In this case, the component property is omitted, otherwise the options will not be applied. This works for either a component created by ForePaas or a spec component (see documentation).
Example: these options will be applied by default as soon as you use a recharts.bar chart
2. Defining a template name
The options will apply as soon as you use this template in the definition of your chart (more details in Step 2: Using templates).
Component names are especially used when you want to define a theme for your application, while template names will be used in more specific cases (for example to make a modification to the theme on a particular chart).
Creating a second template based on a first template
ForePaaS provides a simple way to create templates that not only leverage most of the options from an initial one and but also receive modifications done to the latter automatically.
Simply add the extends element to your template:
?>🌠 Learn more about the extends element here!
Step 2: Using Templates
To use your templates, you have 2 possibilities:
- Architect (via the platform)
- Locally (via config .json files)
Via Architect
You will find the templates you previously created while selecting the type of chart in the category 'Custom'.

You just have to select it from the chart, indicate the request and validate it at the top right.
Locally
Whether locally or via the platform editor, you just need to enter the name of your template as the value of the component of your chart:

If you wish to modify one of the options, you can modify them in the option object. These will add and / or replace the options defined in the template (exactly as the extend seen above).
Bonus: Addition of configurable options via Architect
These options are those that you can configure from Architect, the chart creation or editing interface.

When you define your charts and options via your code, it is easy to rewrite an option of a template (such as a color for example) by indicating it in the options of the chart.
But it's not that easy if you (or your users) are using Architect. Indeed, your new templates are now available from this UI but apart from the charts defined by ForePaaS and their pre-configured options, you cannot modify or rewrite the options defined in your template without going through the json configuration in the advanced mode (which is not the most intuitive for your users).
There are ways to add options in this interface in order to simplify creating or editing a chart for your users.
To sum it up, using a config in .json you will be able to manage a form accessible via the chart creation/edition UI which will add the relative keys & values in the options object of your chart.
The type of the option (object, text, number, table, ...) is defined first, then the type of the input.
Example:
Will generate the following object (because the type is object) in the options:
By adding this configuration in the optionsArchitect property, you will find these options in the options tab from your chart configuration.
Here is an example configuration:
Which gives the following result:

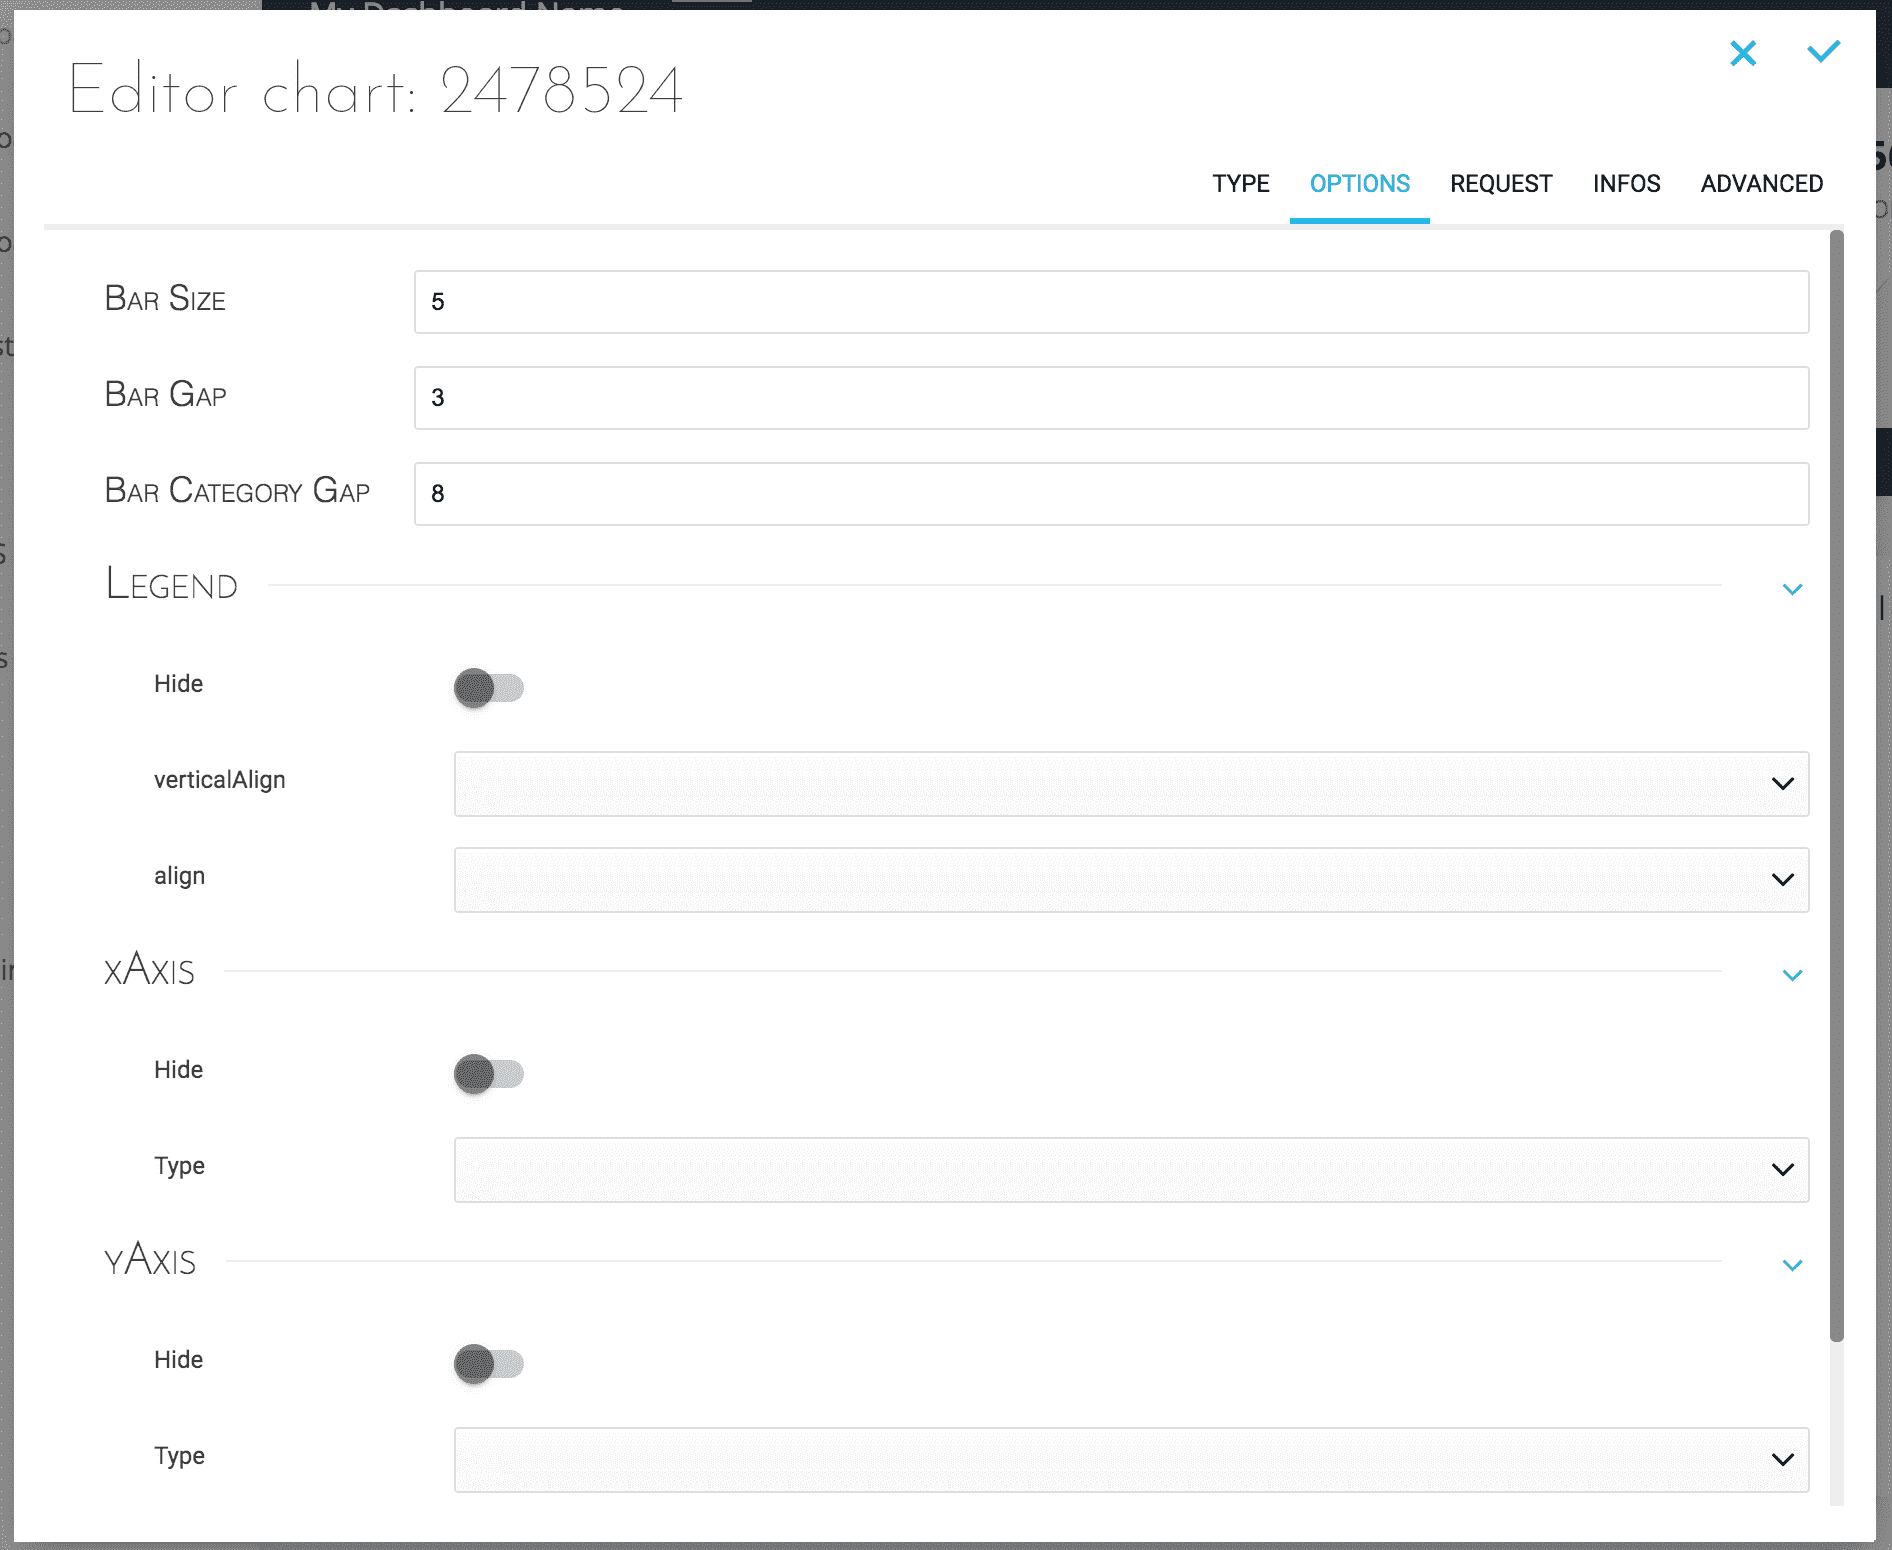
Tip: Do not hesitate to have a look at how the options of the libraries already defined by the platform are defined: see file
forepaas.json-> keyoptionsfor more examples.
Go further
If you need training or technical assistance to implement our solutions, contact your sales representative or click on this link to get a quote and ask our Professional Services experts for a custom analysis of your project.
Ask questions, give your feedback and interact directly with the team building the Data Platform on the dedicated Discord channel.
If you need support with your OVHcloud services, create a request in our Help Centre.
Join our community of users.