

Spark History Server
It applies to PySpark-based actions (Load PySpark, Aggregate PySpark, Custom PySpark) and the workflows that run them
Objective
The Spark History Server lets you inspect the execution history of your Spark jobs directly from the Data Processing Engine, without setting up any external tooling.
It applies to PySpark-based actions (Load PySpark, Aggregate PySpark, Custom PySpark) and the workflows that run them. It does not cover notebooks.
Once enabled, every PySpark job records its event logs. You start the server when you need to read them, browse your recent runs, open each run's Spark UI (live or completed), analyze it with DataFlint, and apply retention rules to keep storage under control.
The server is billed per DPU for the time it is running. It runs only on demand and shuts down automatically after a period of inactivity, so you don't pay for idle time.
Start and stop the server
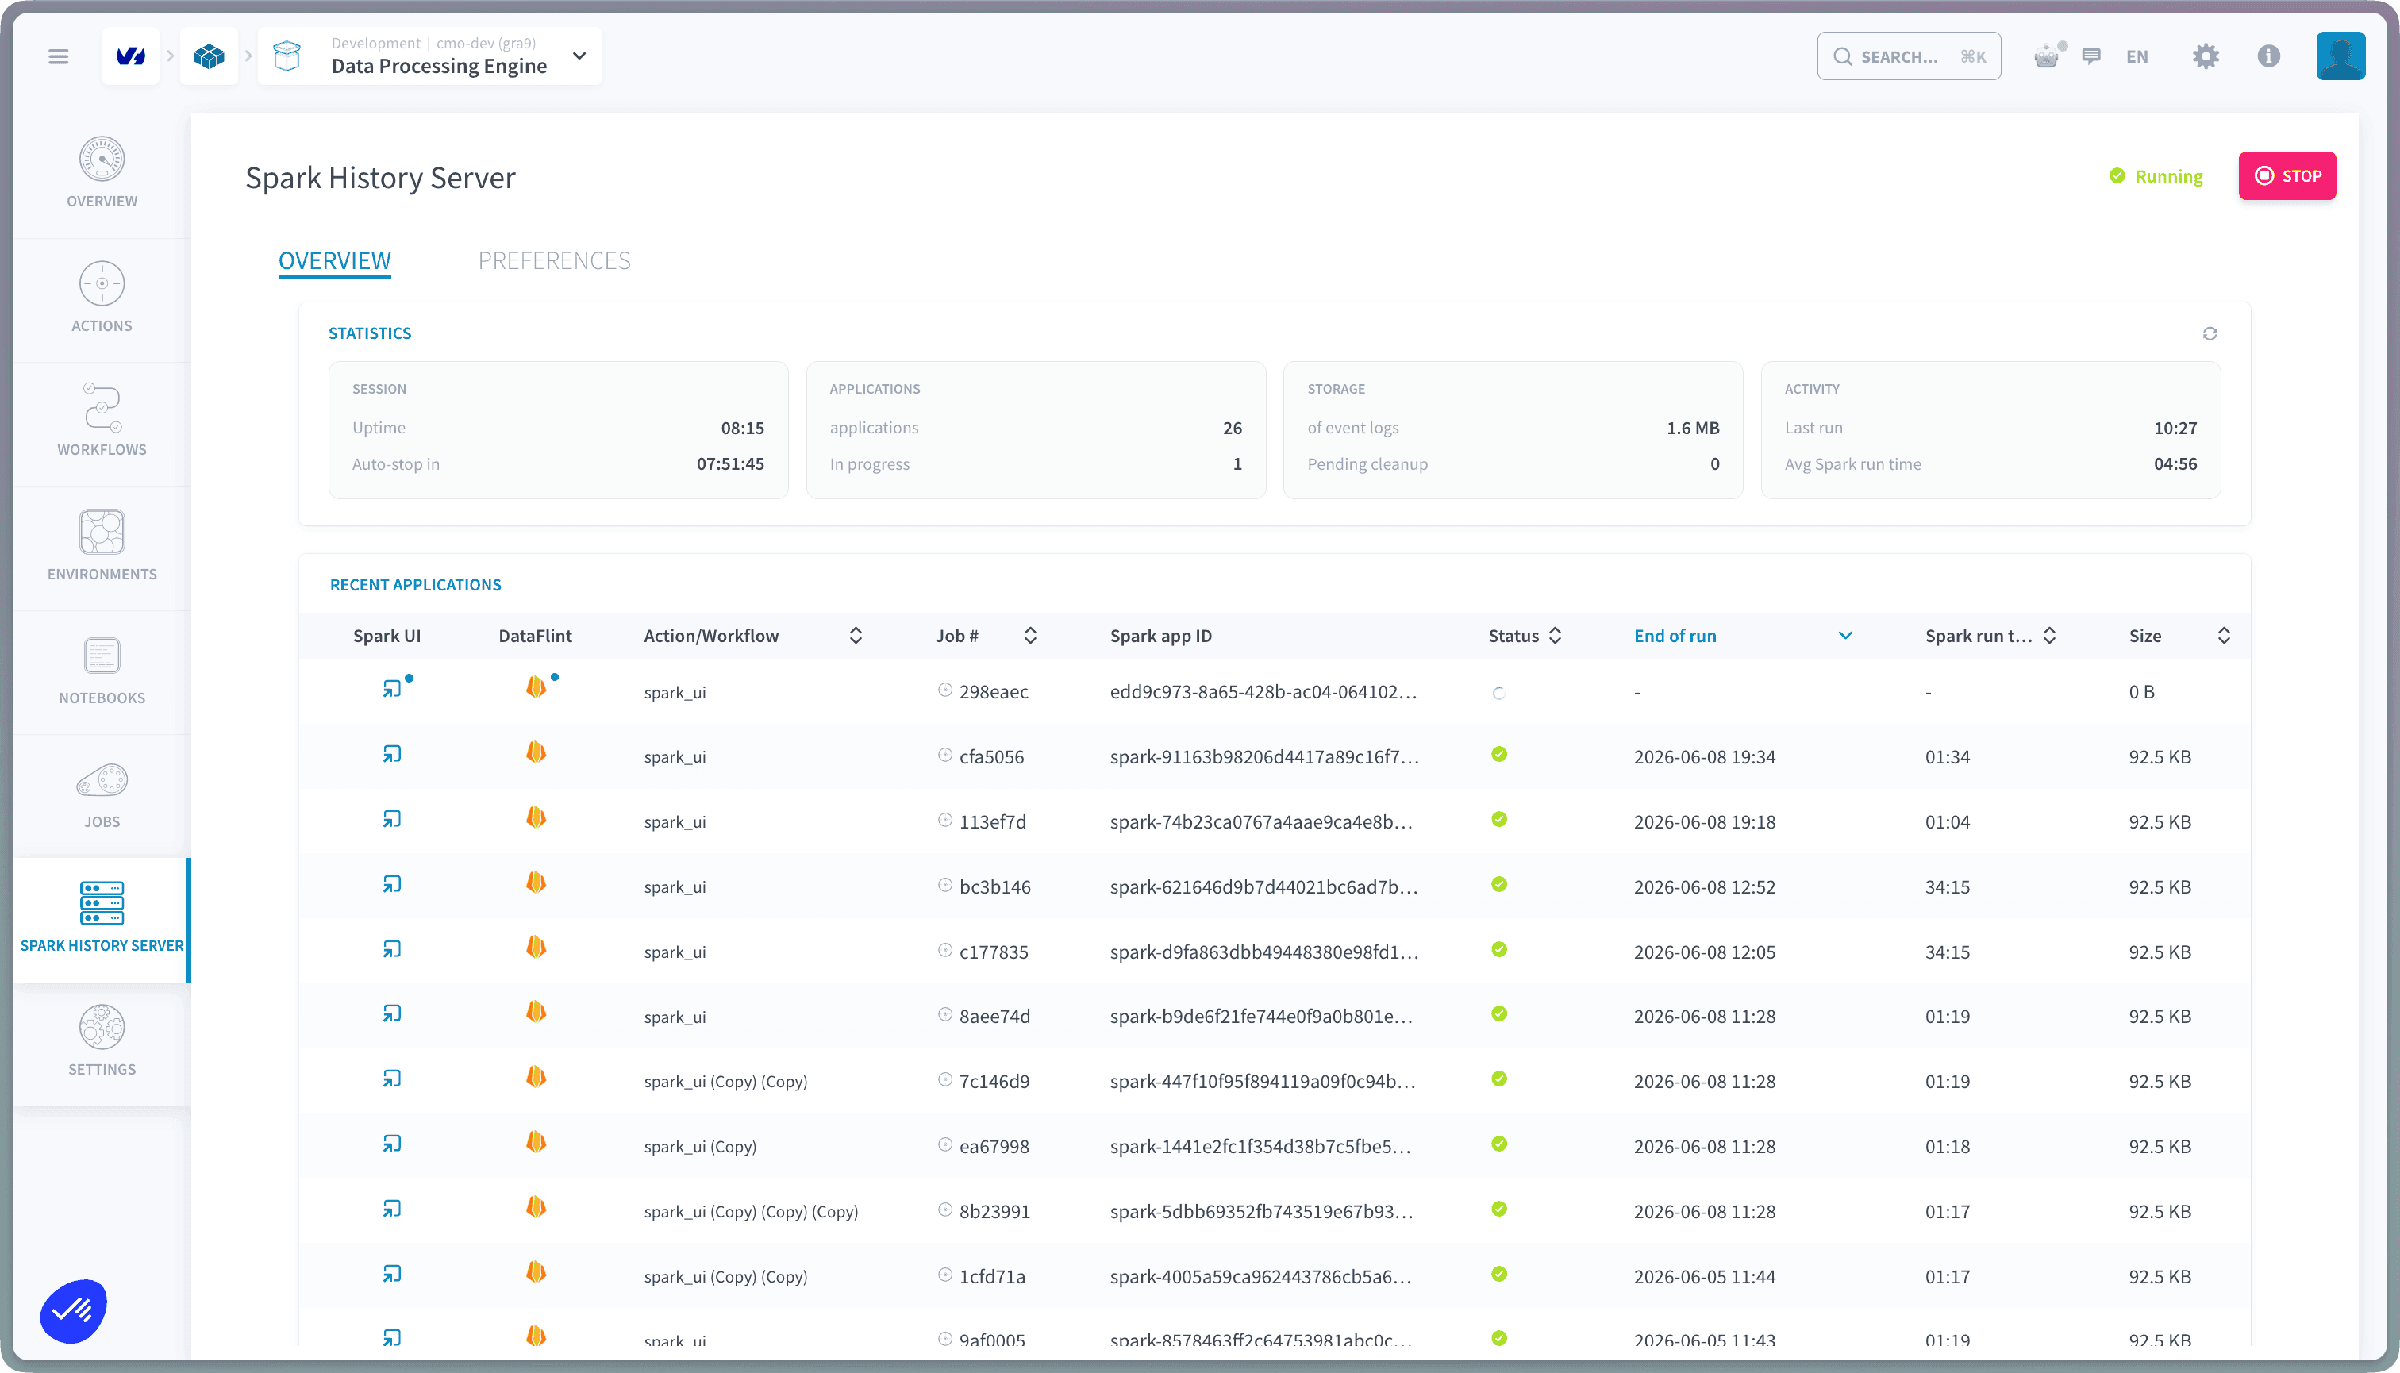
The History Server runs only when you need it. Use the Start button at the top right of the page to launch it; its status (Stopped / Running), uptime, and time before auto-stop are shown next to it.
The server stops on its own after the inactivity period set in the Preferences, so it never stays up longer than needed. You can also stop it manually at any time.
Overview
The Overview tab summarizes your environment and lists your recent Spark runs.
Statistics
The Statistics panel gives you a snapshot of your environment:
- Applications: total number of applications and how many are currently in progress.
- Storage: total size of stored event logs and the amount pending cleanup.
- Activity: time of the last run and the average Spark run time.
Recent applications
The Recent applications table lists your most recent Spark runs with their action or workflow name, job number, Spark app ID, status, end of run, Spark run time, and size.
From each row you get one-click access to:
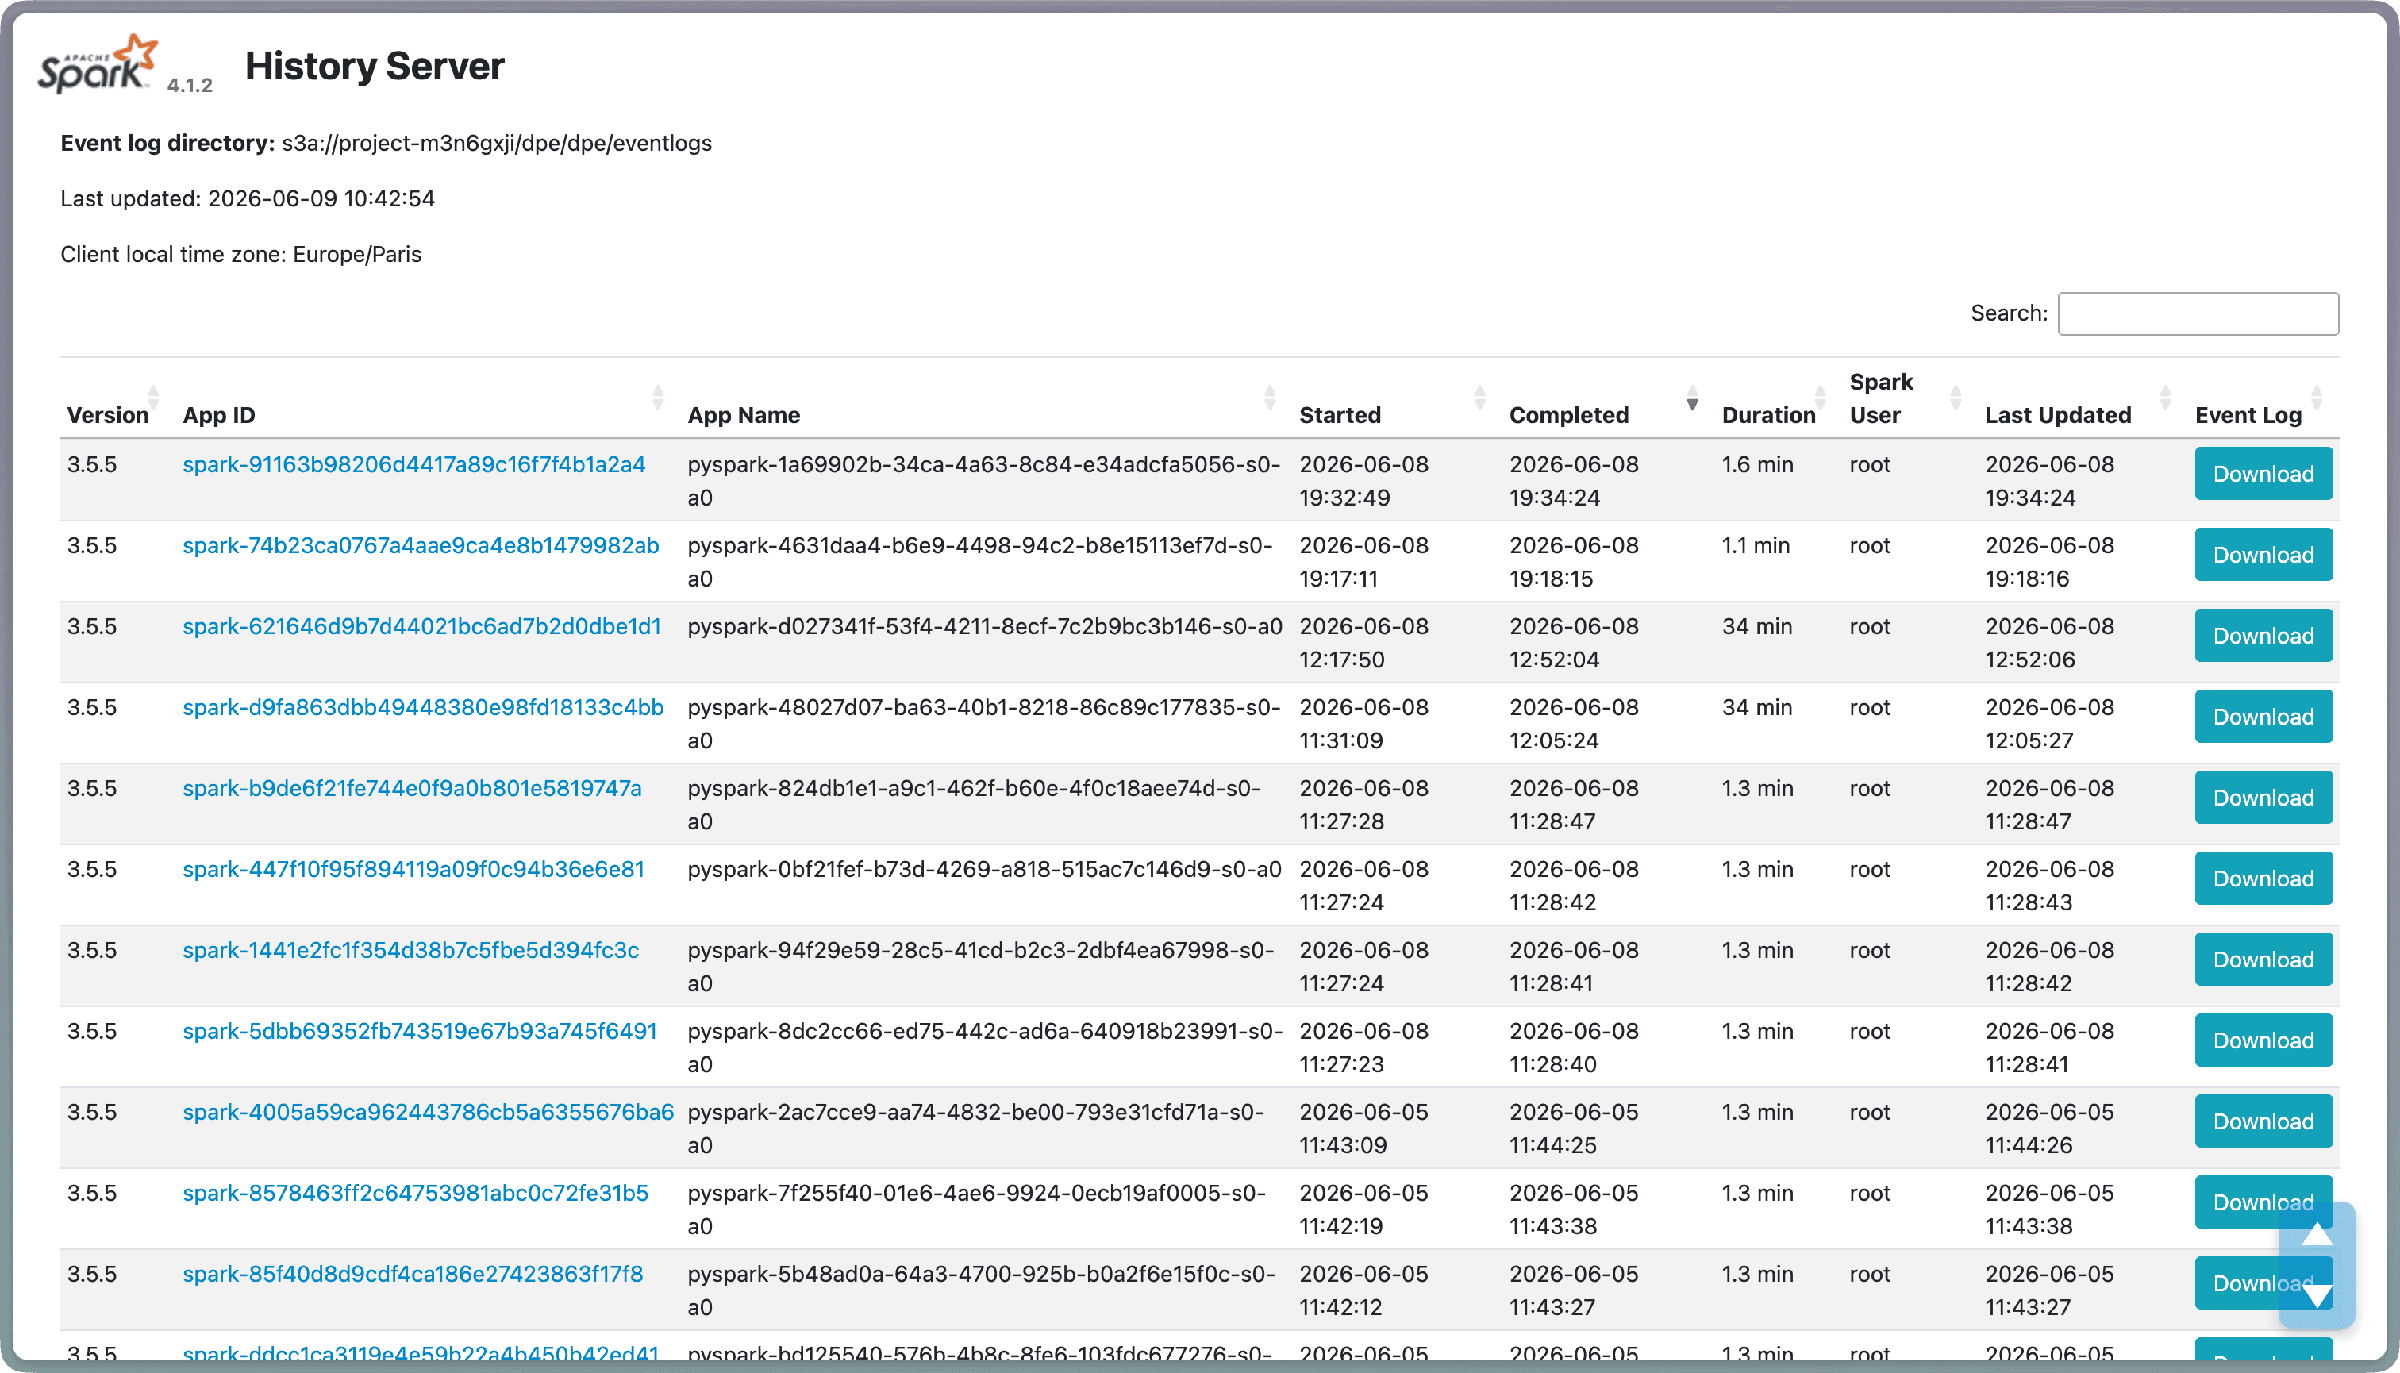
- Spark UI: the standard Spark interface to explore stages, tasks, and execution details.
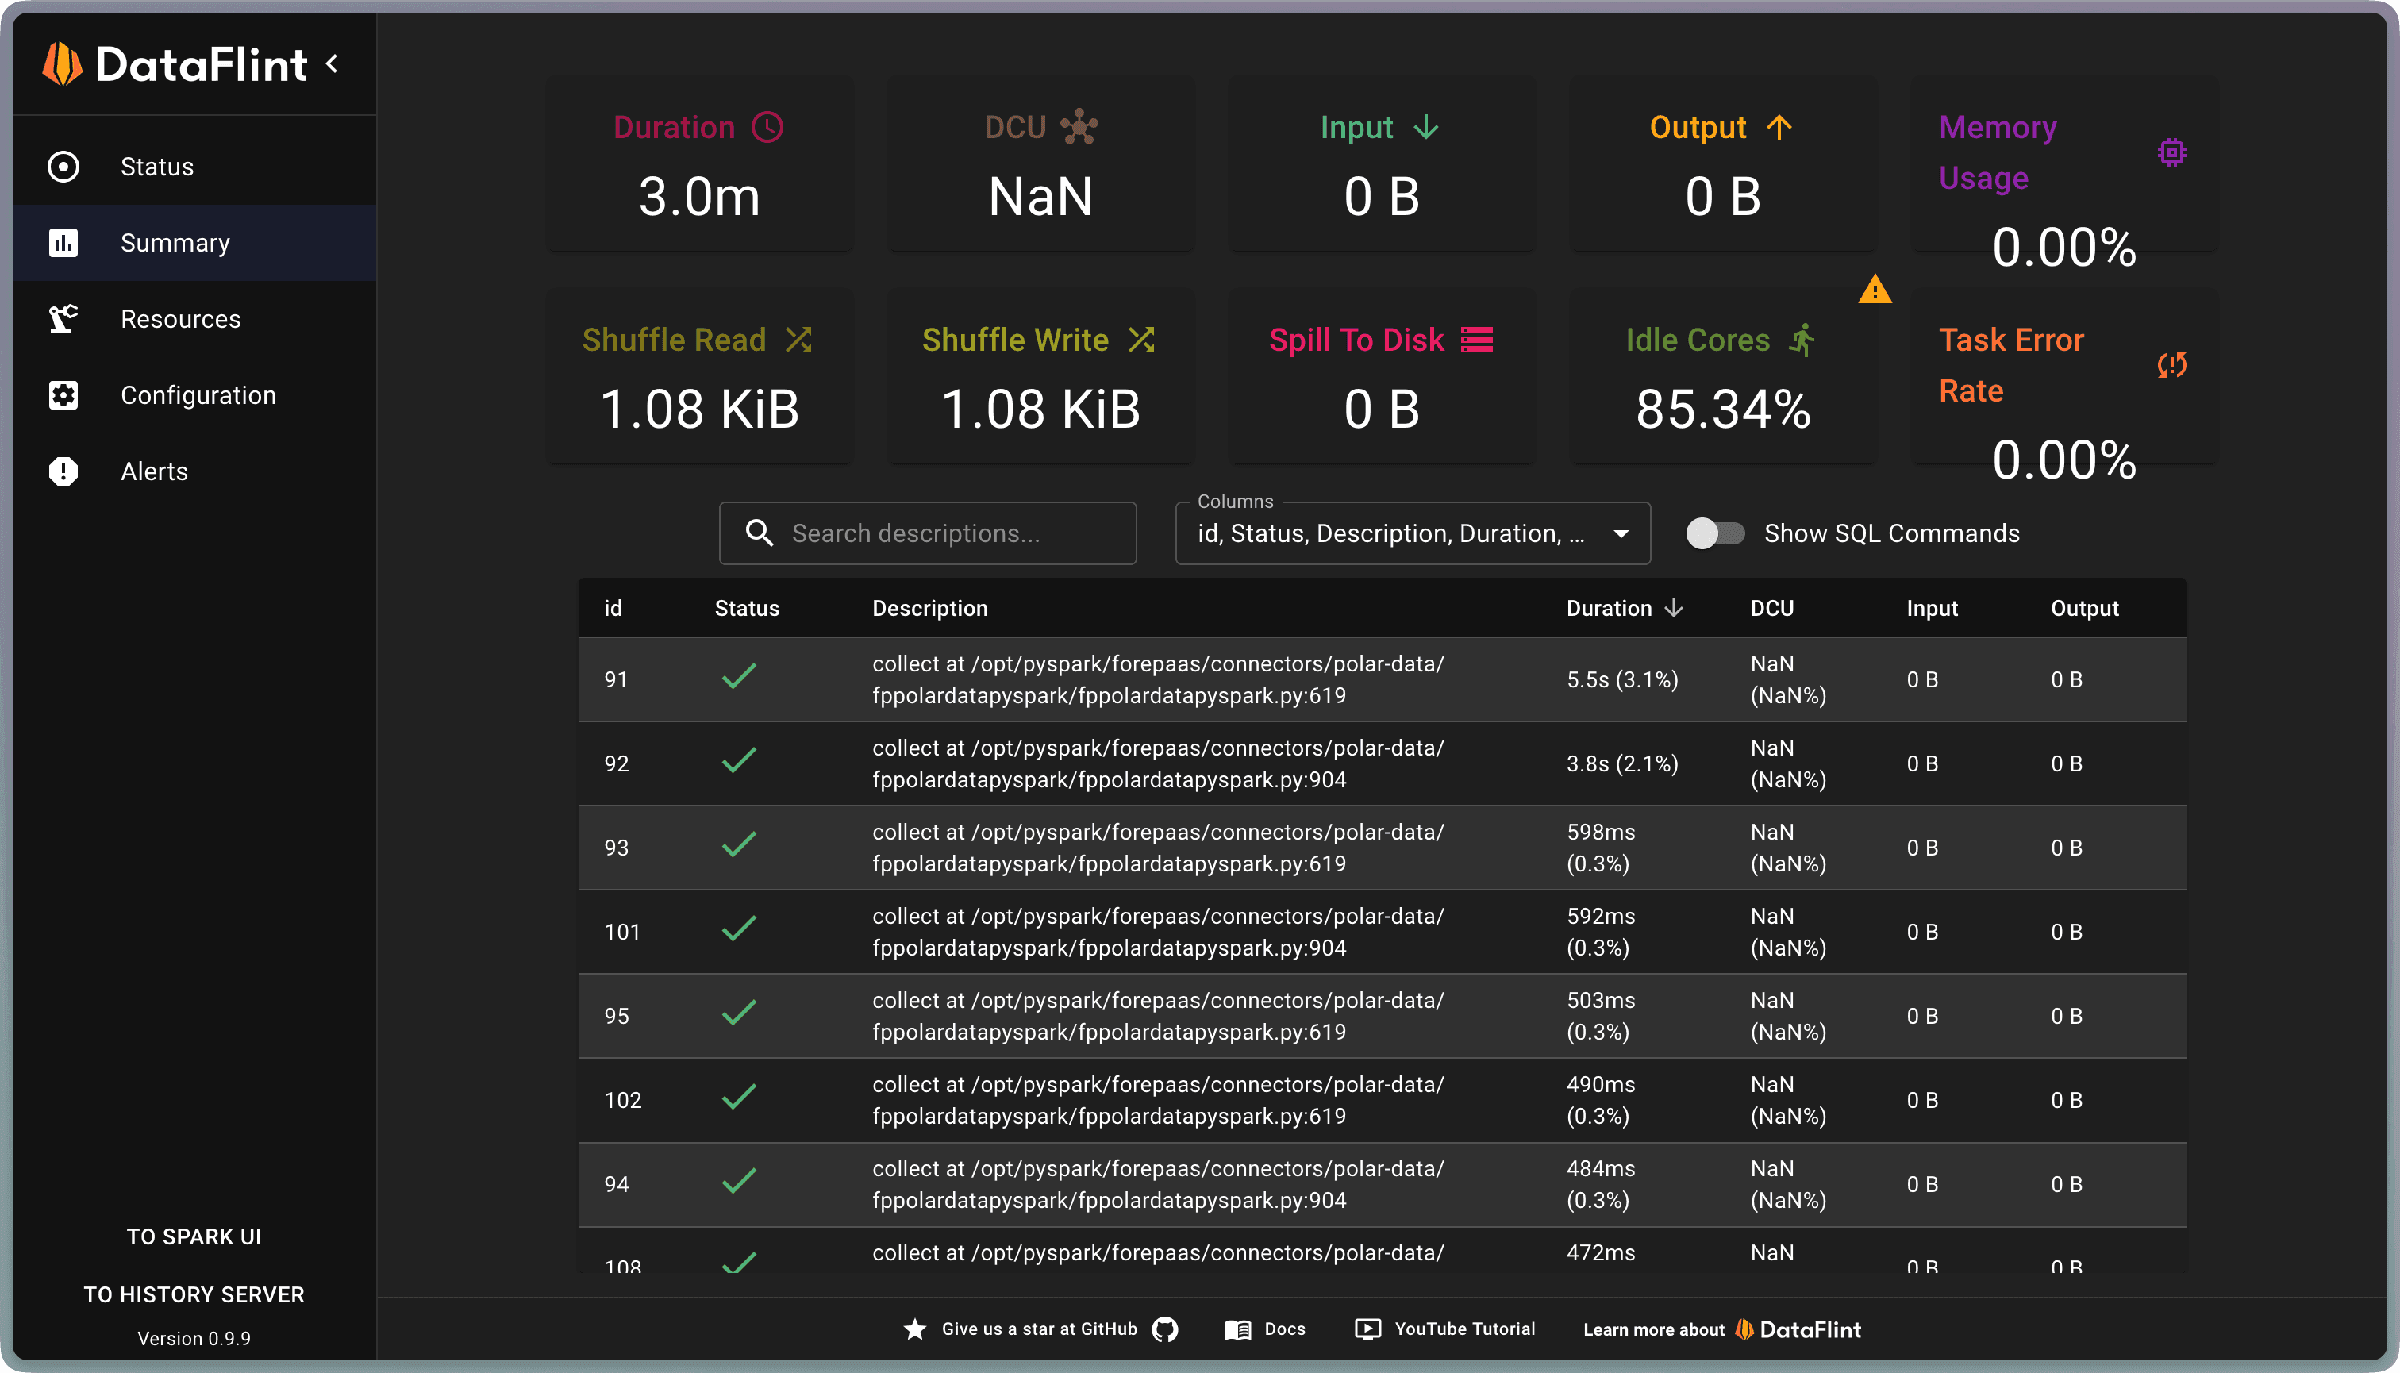
- DataFlint: an enhanced analysis view with performance insights and optimization tips, powered by the open-source DataFlint project.
Opening Spark UI gives you the full standard Spark interface for the run, where you can explore jobs, stages, and tasks:
DataFlint layers performance insights and optimization tips on top of the same run:
You can also reach a specific run from the Jobs page: select a Spark job (a PySpark action or workflow) to open it in the Spark History Server.
Follow running jobs
Running jobs appear at the top of the table, marked as live. As soon as a job's interface is ready, you can open its live Spark UI and DataFlint view without waiting for the run to finish.
Live interfaces are only available for running jobs when Live Spark UI is enabled in the Preferences.
Preferences
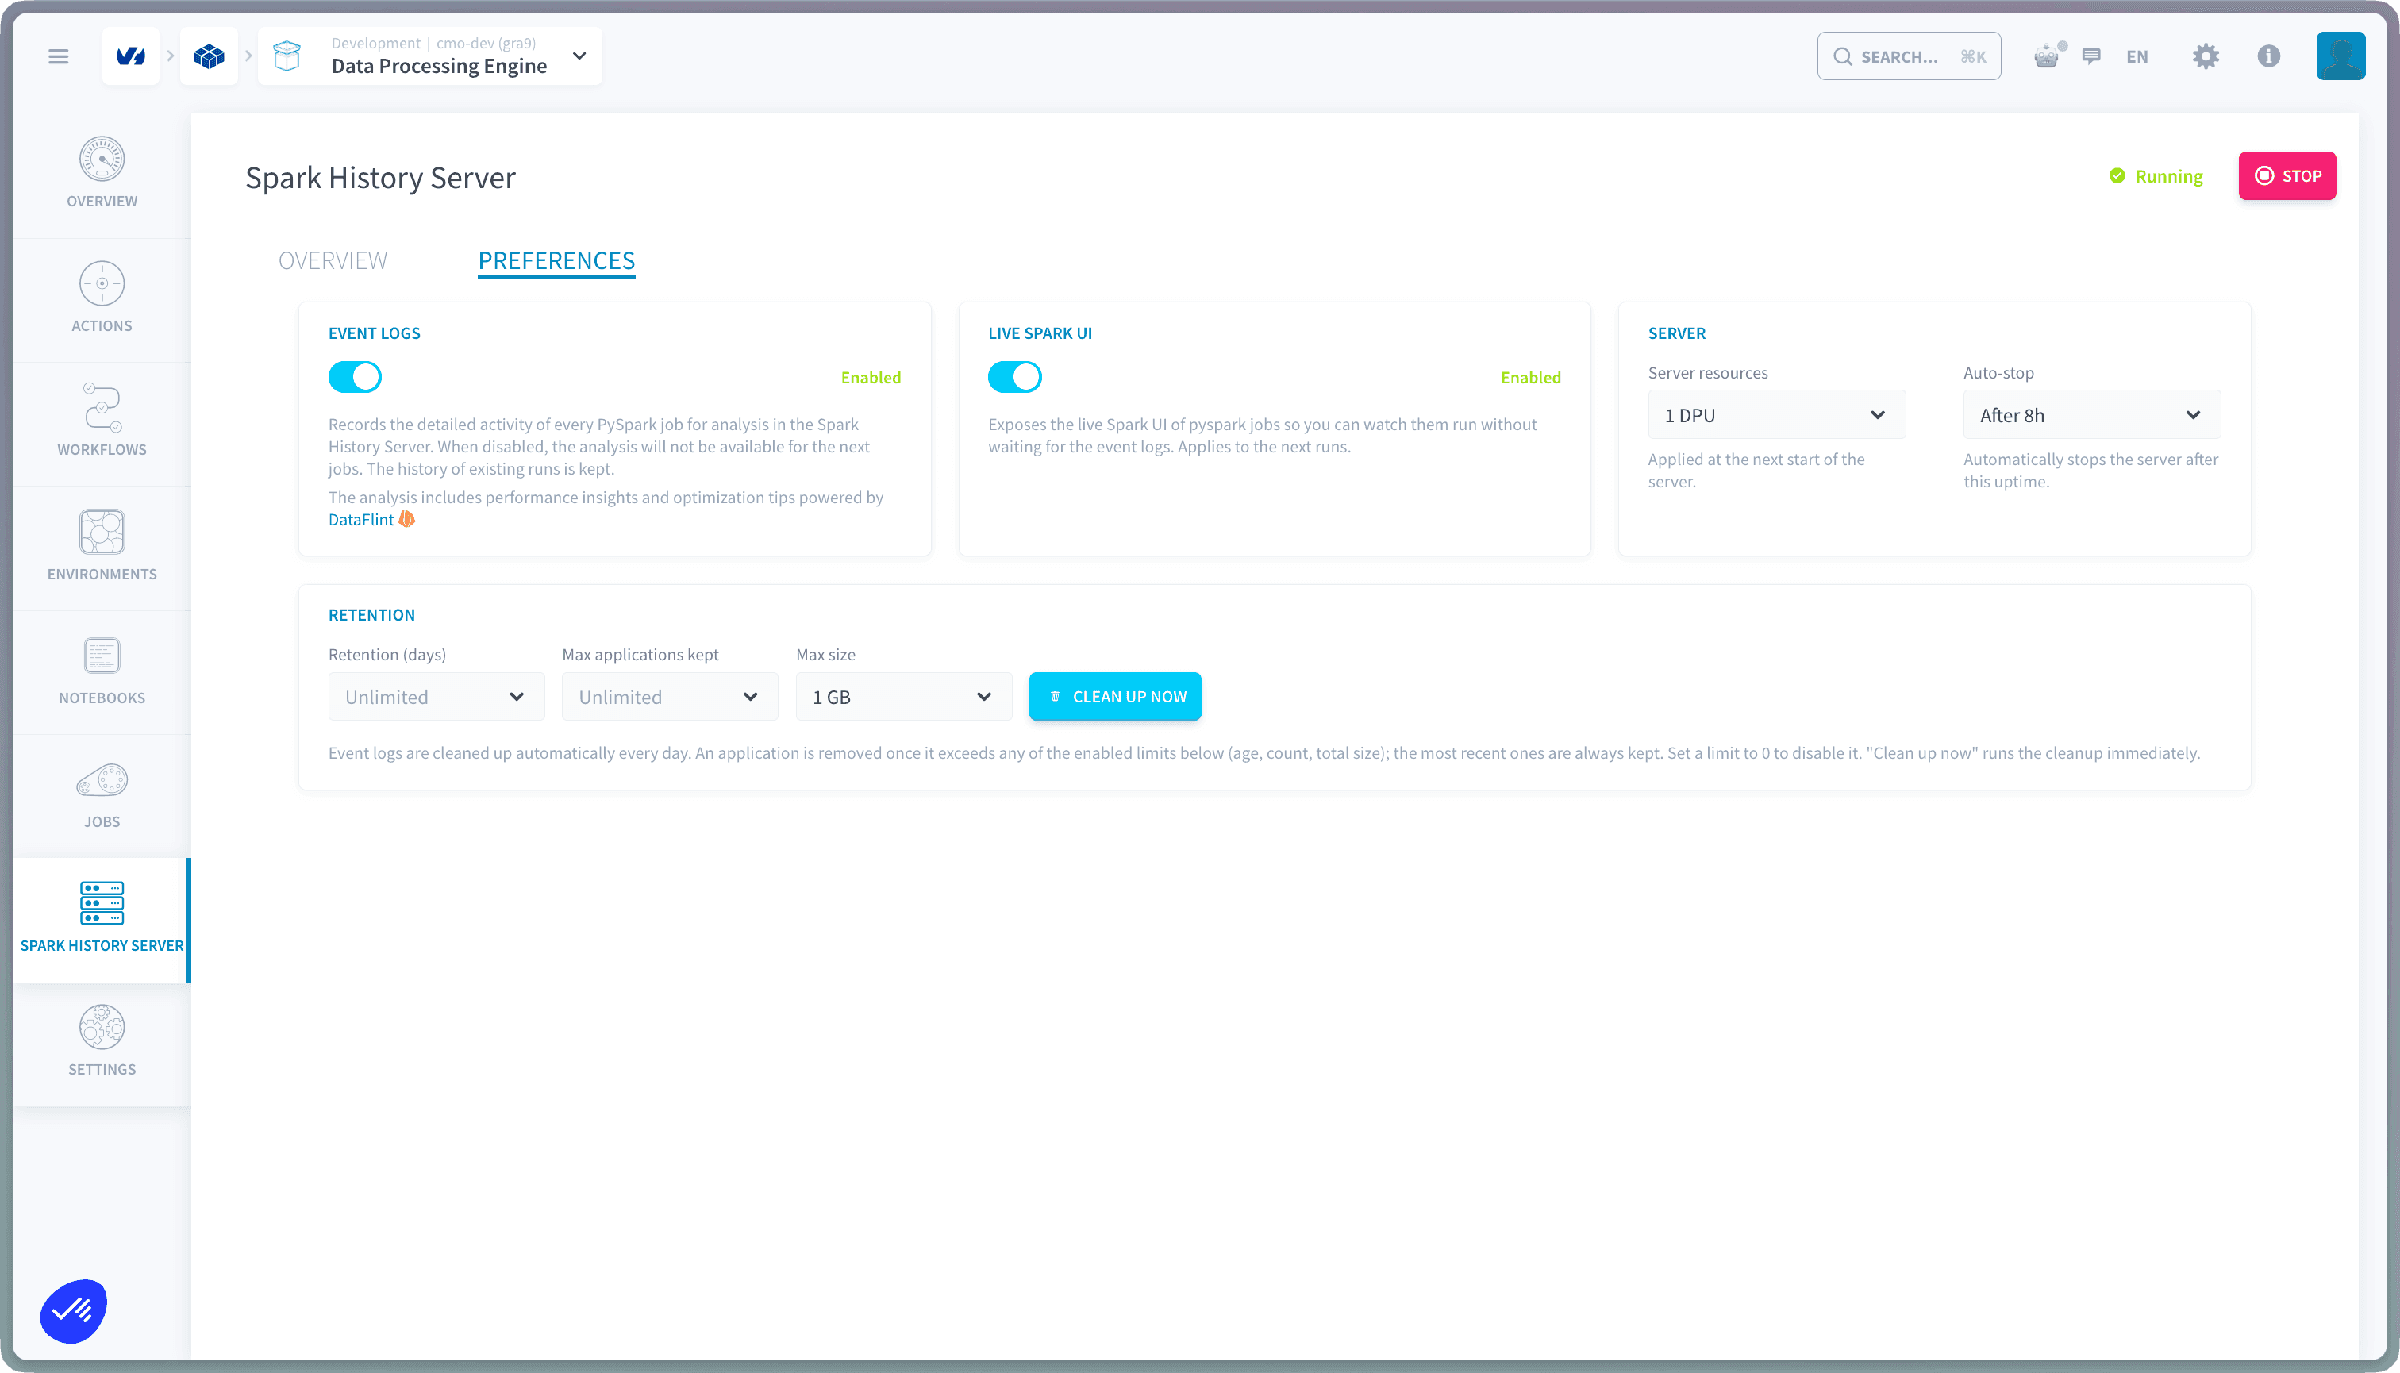
The Preferences tab controls what is captured, the size of the server, when it stops, and how long logs are kept.
Event logs
Enabled by default. Records the detailed activity of every PySpark job for analysis in the Spark History Server, including the performance insights and optimization tips powered by DataFlint.
When disabled, the analysis is not available for the next jobs. The history of existing runs is kept.
Event logs are stored in your project's DPE S31 bucket. The Retention rules below control how much of that storage they use.
Live Spark UI
Disabled by default. Exposes the live Spark UI of PySpark jobs so you can watch them run without waiting for the event logs. The setting applies to the next runs.
Server resources and auto-stop
- Server resources: the compute power allocated to the server, from 1 to 4 DPU. The change is applied at the next start of the server.
- Auto-stop: automatically stops the server after the selected period of inactivity. Options: Never, After 2 hours, or After 8 hours. The default is 24 hours.
Retention
Event logs are cleaned up automatically every day. An application is removed once it exceeds any of the enabled limits below; the most recent applications are always kept. Set a limit to 0 (or Unlimited) to disable it. Use Clean up now to run the cleanup immediately.
- Retention (days): how long applications are kept. Options: 7 (default), 30, 90, 365, or Unlimited.
- Maximum applications kept: options 100 (default), 10, 50, 100, 500, or Unlimited.
- Maximum total size: options 1, 5, 10, or 50 GB, or Unlimited.
Go further
If you need training or technical assistance to implement our solutions, contact your sales representative or click on this link to get a quote and ask our Professional Services experts for a custom analysis of your project.
Ask questions, give your feedback and interact directly with the team building the Data Platform on the dedicated Discord channel.
If you need support with your OVHcloud services, create a request in our Help Centre.
Join our community of users.
1: S3 is a trademark of Amazon Technologies, Inc. OVHcloud's service is not sponsored by, endorsed by, or otherwise affiliated with Amazon Technologies, Inc.