

Use the visual builder
The visual builder offers a generic way to query stored information using a specific proprietary framework built on top of open-source query engines
Objective
The visual builder offers a generic way to query stored information using a specific proprietary framework built on top of open-source query engines.
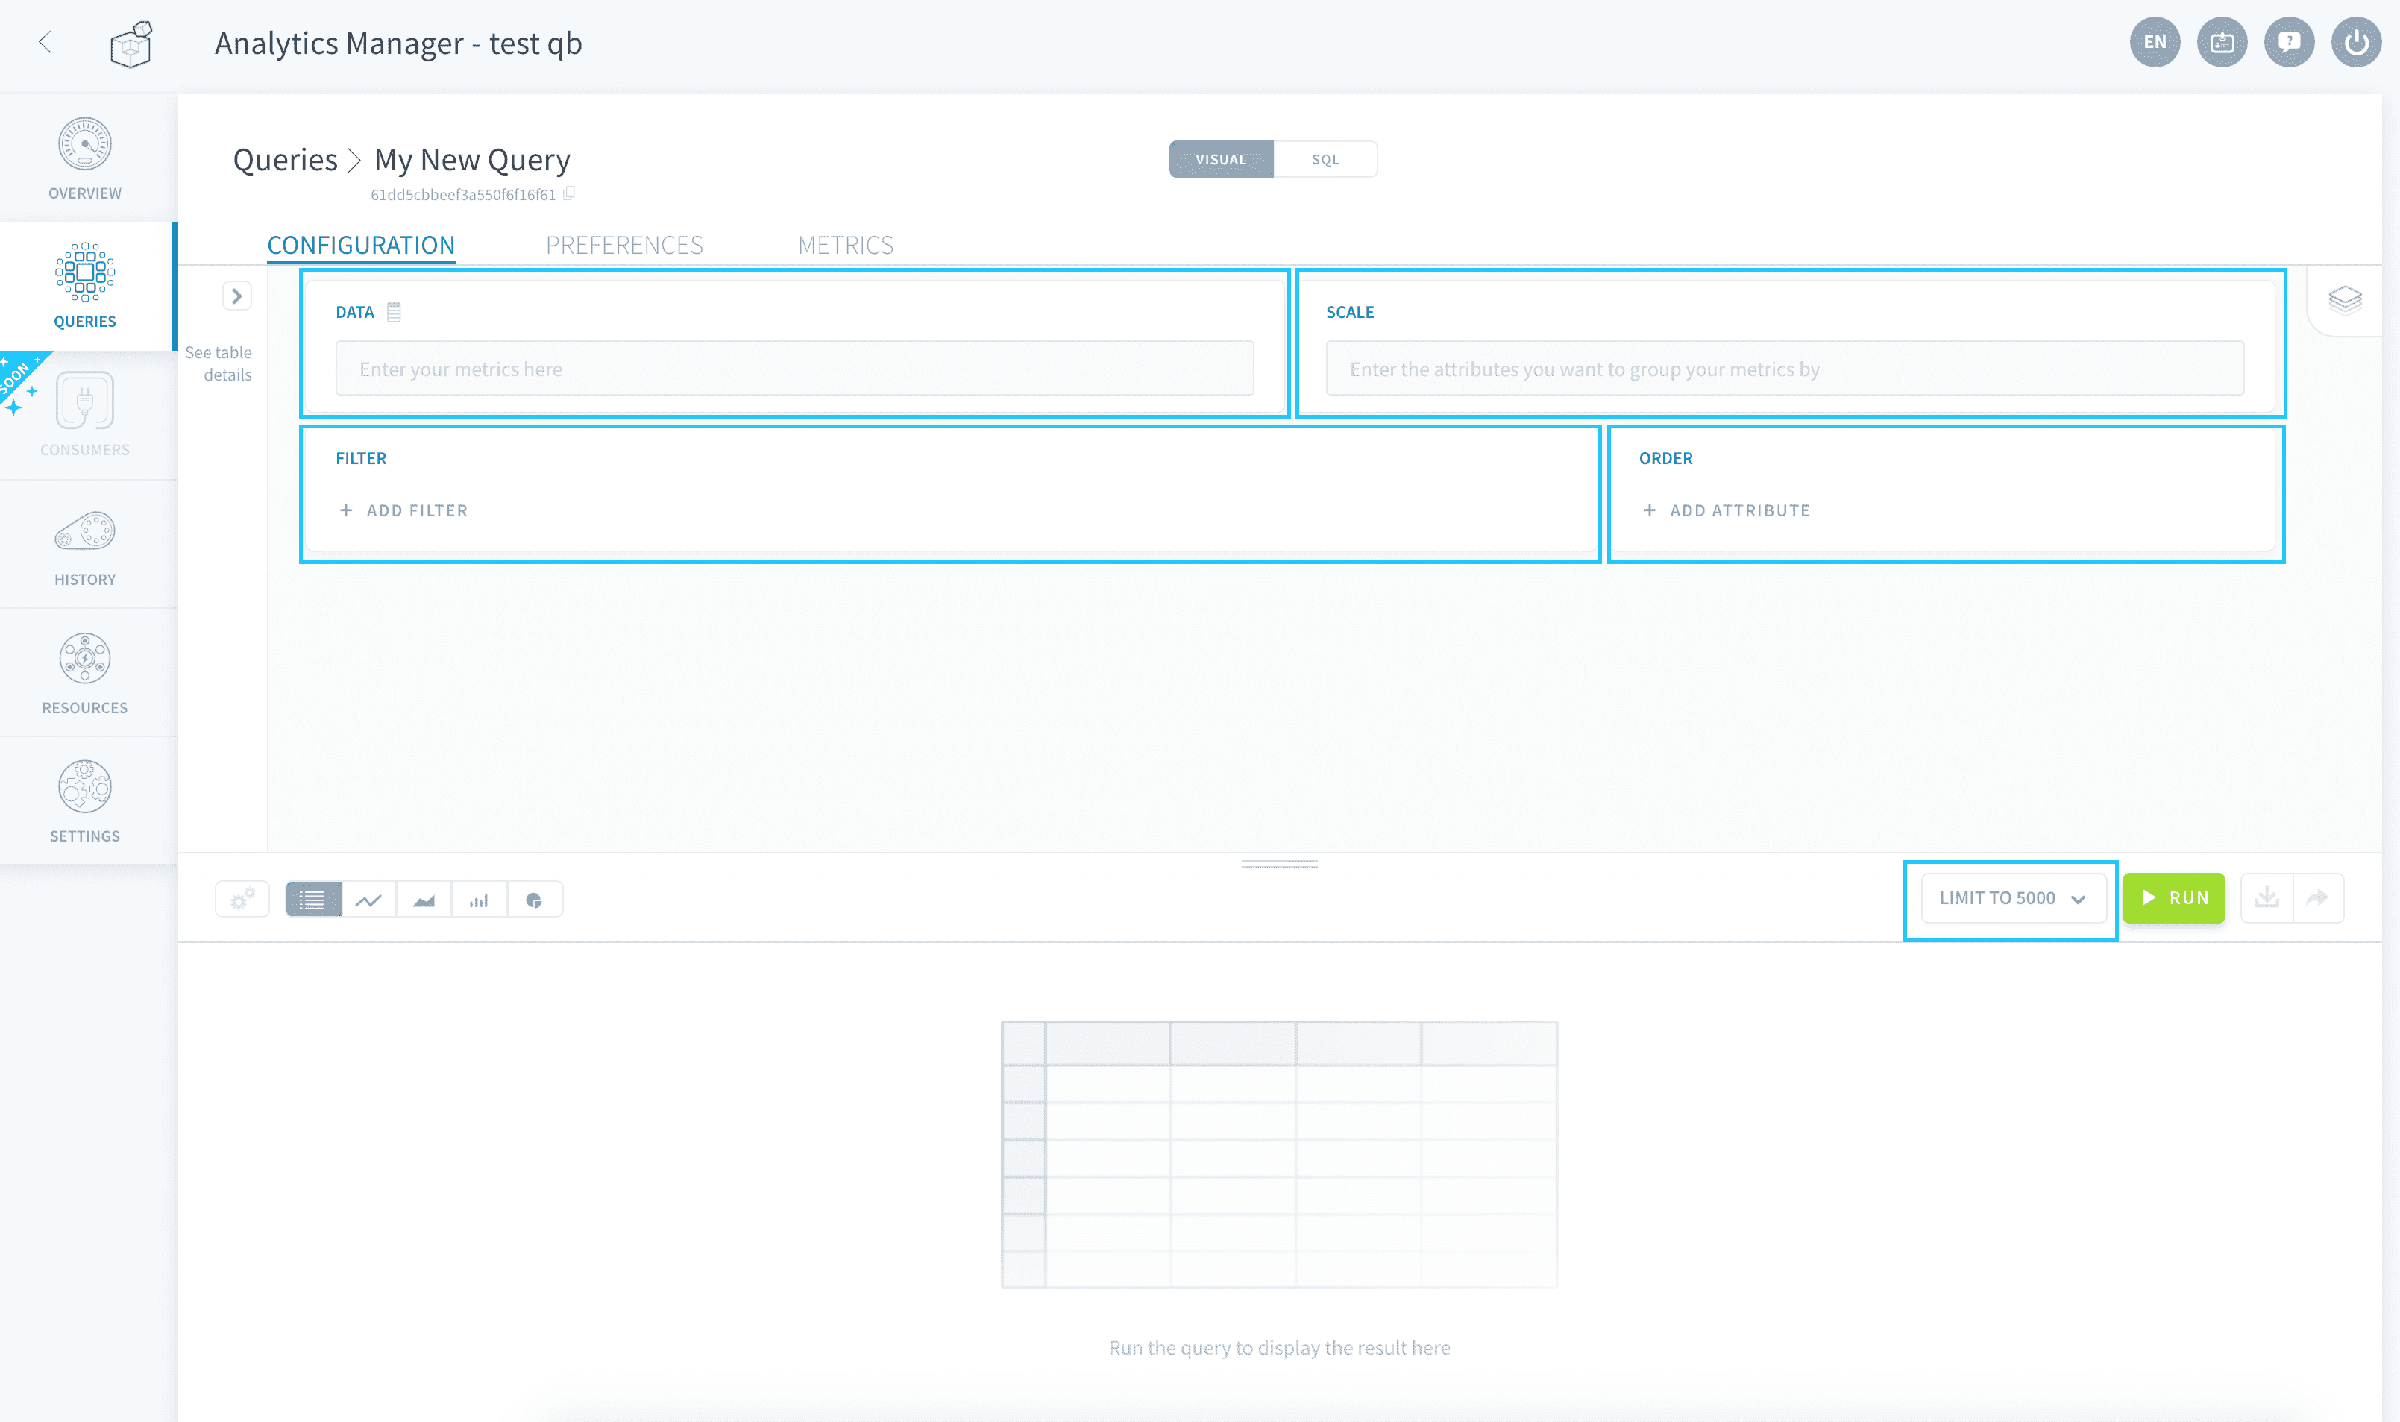
Queries are created by populating the 4 following fields with attributes from your Lakehouse Manager:
- Data: the measures that you want to aggregate
- Scale: the dimensions by which you want to group your data
- Filter: to filter the results of your query
- Order: to sort the results of your query
In addition, you can set a limit to the number of rows returned by the interface by using the widget next to the Run button. This limit will not be saved in the query for downstream processes (APIs and apps).
Learn how to configure a query
How does it work?
Let's assume for instance that the people in charge of developing visualization dashboards want to display a turnover curve (attribute: income) by date (attribute: date).
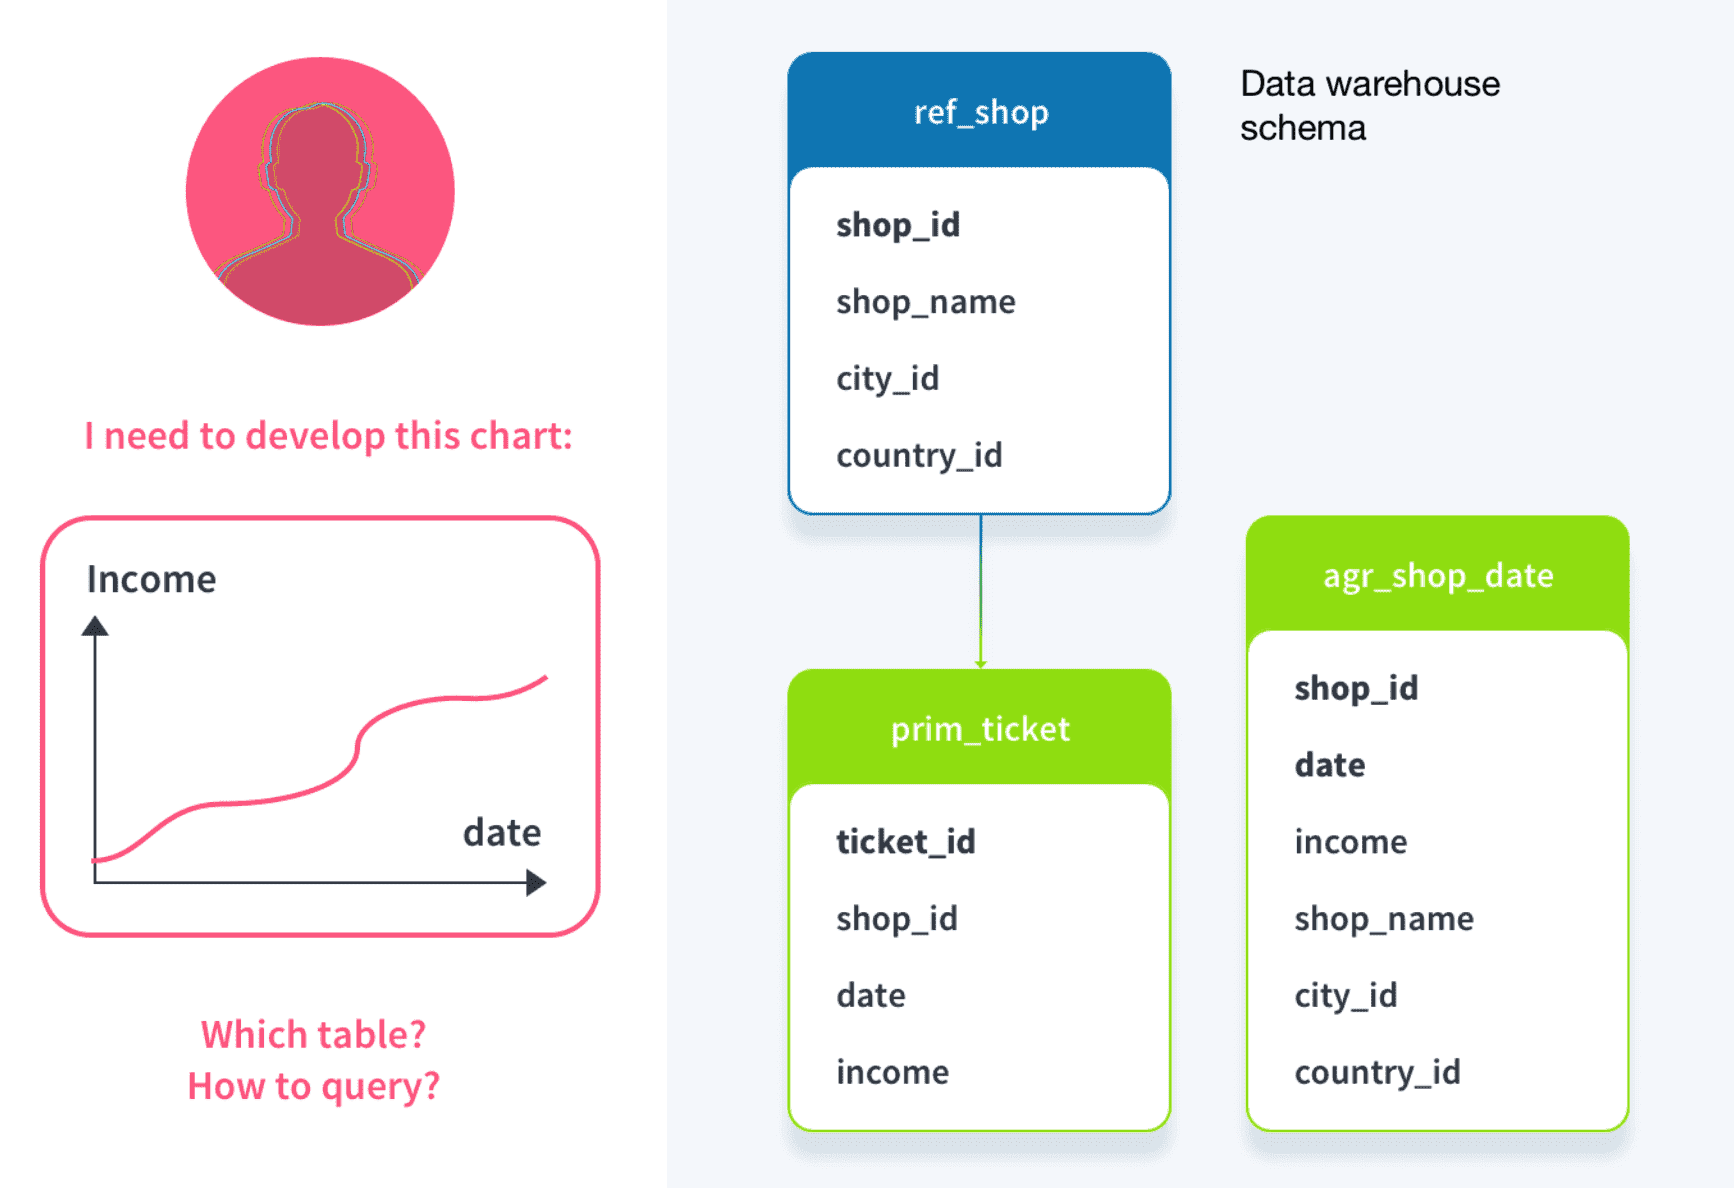
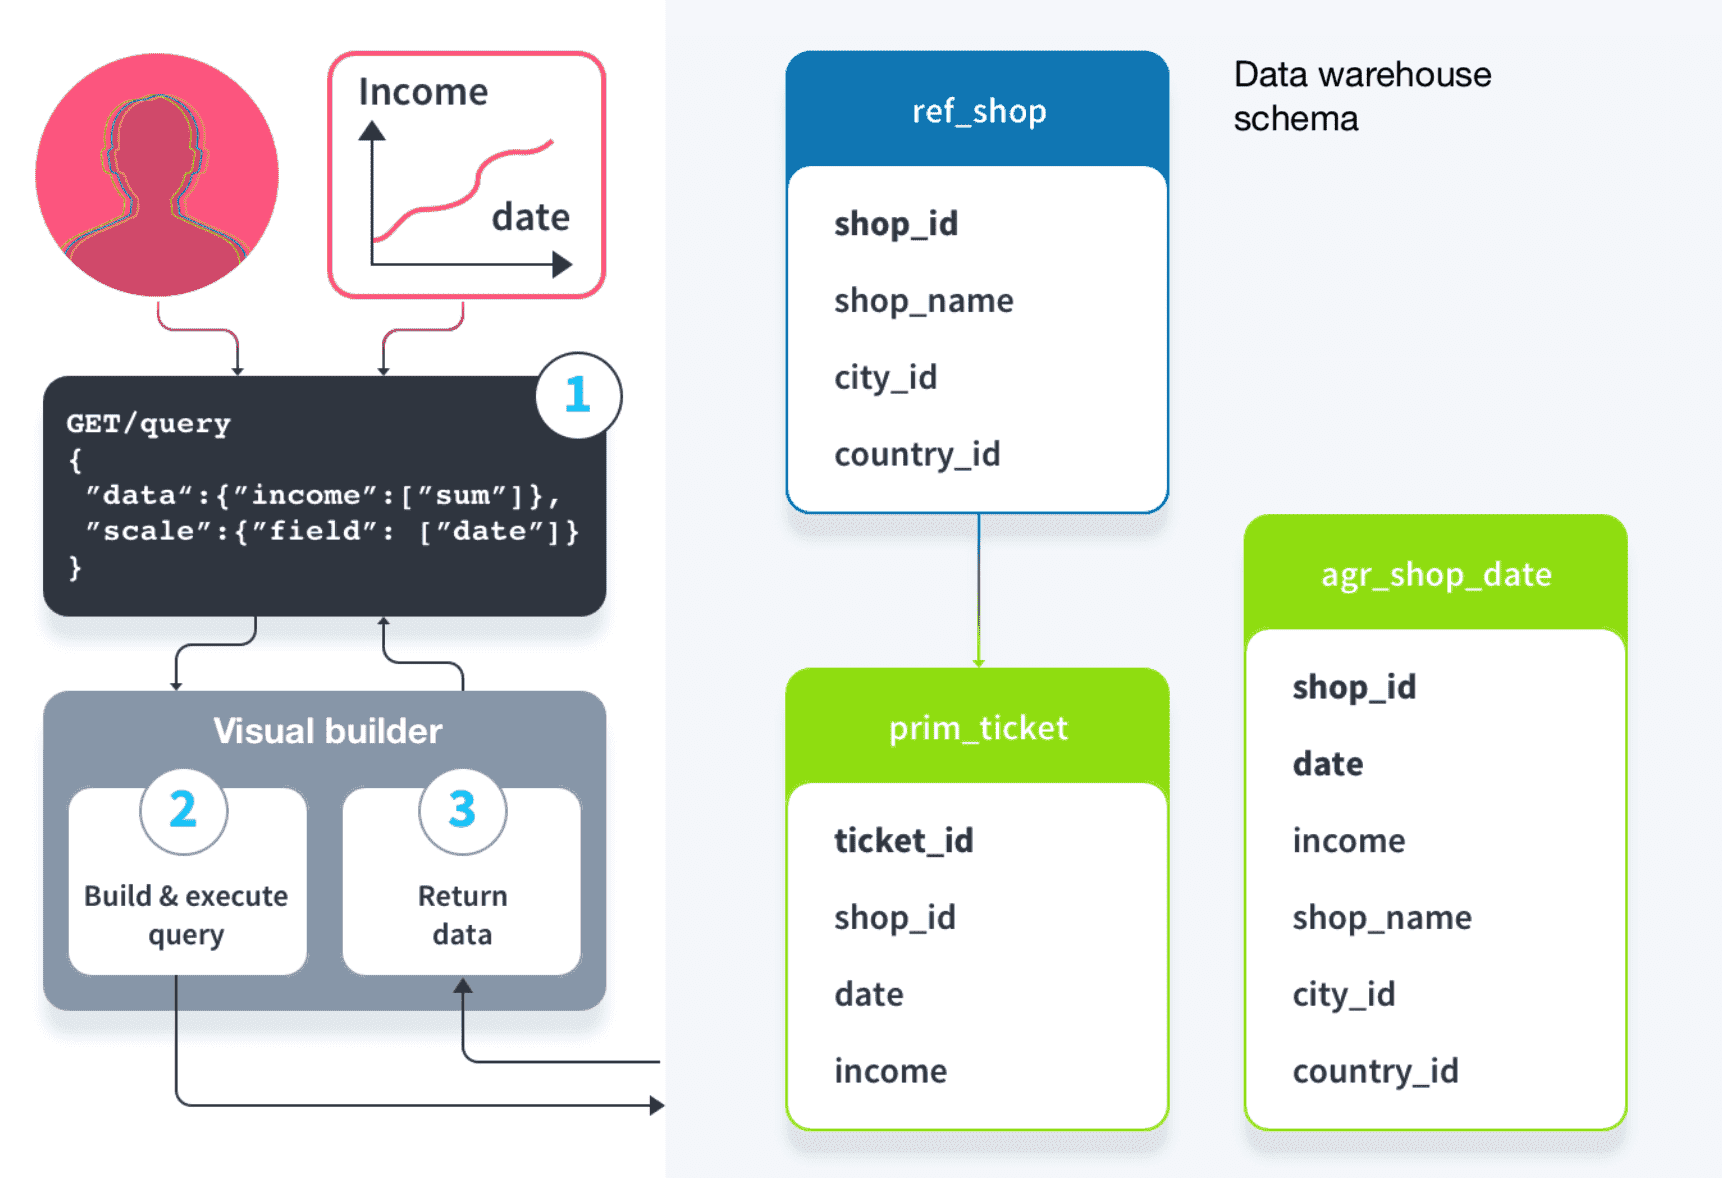
- The visual builder interface can be used to specify the data to display (data: income), and the metric with which to group this data by (scale: date).
- At this point the builder automatically determines which table is the most appropriate for the query - the smallest to contain all required attributes. In the example, "agr_shop_date", which is a table with income data aggregated by dates, will be selected and queried.
The visual builder does not ask you to specify a table. This ensures that your Project can scale easily in time as the storage system you use for your data varies (nature, amount of information stored, data warehouse schema, etc.)
- Finally the results are sent back to the user as a light-weight, DBMS-agnostic JSON object.
Configure the field Data
In the field Data enter the attributes that you want to display. It is possible to aggregate the data to display, using simple aggregation functions.
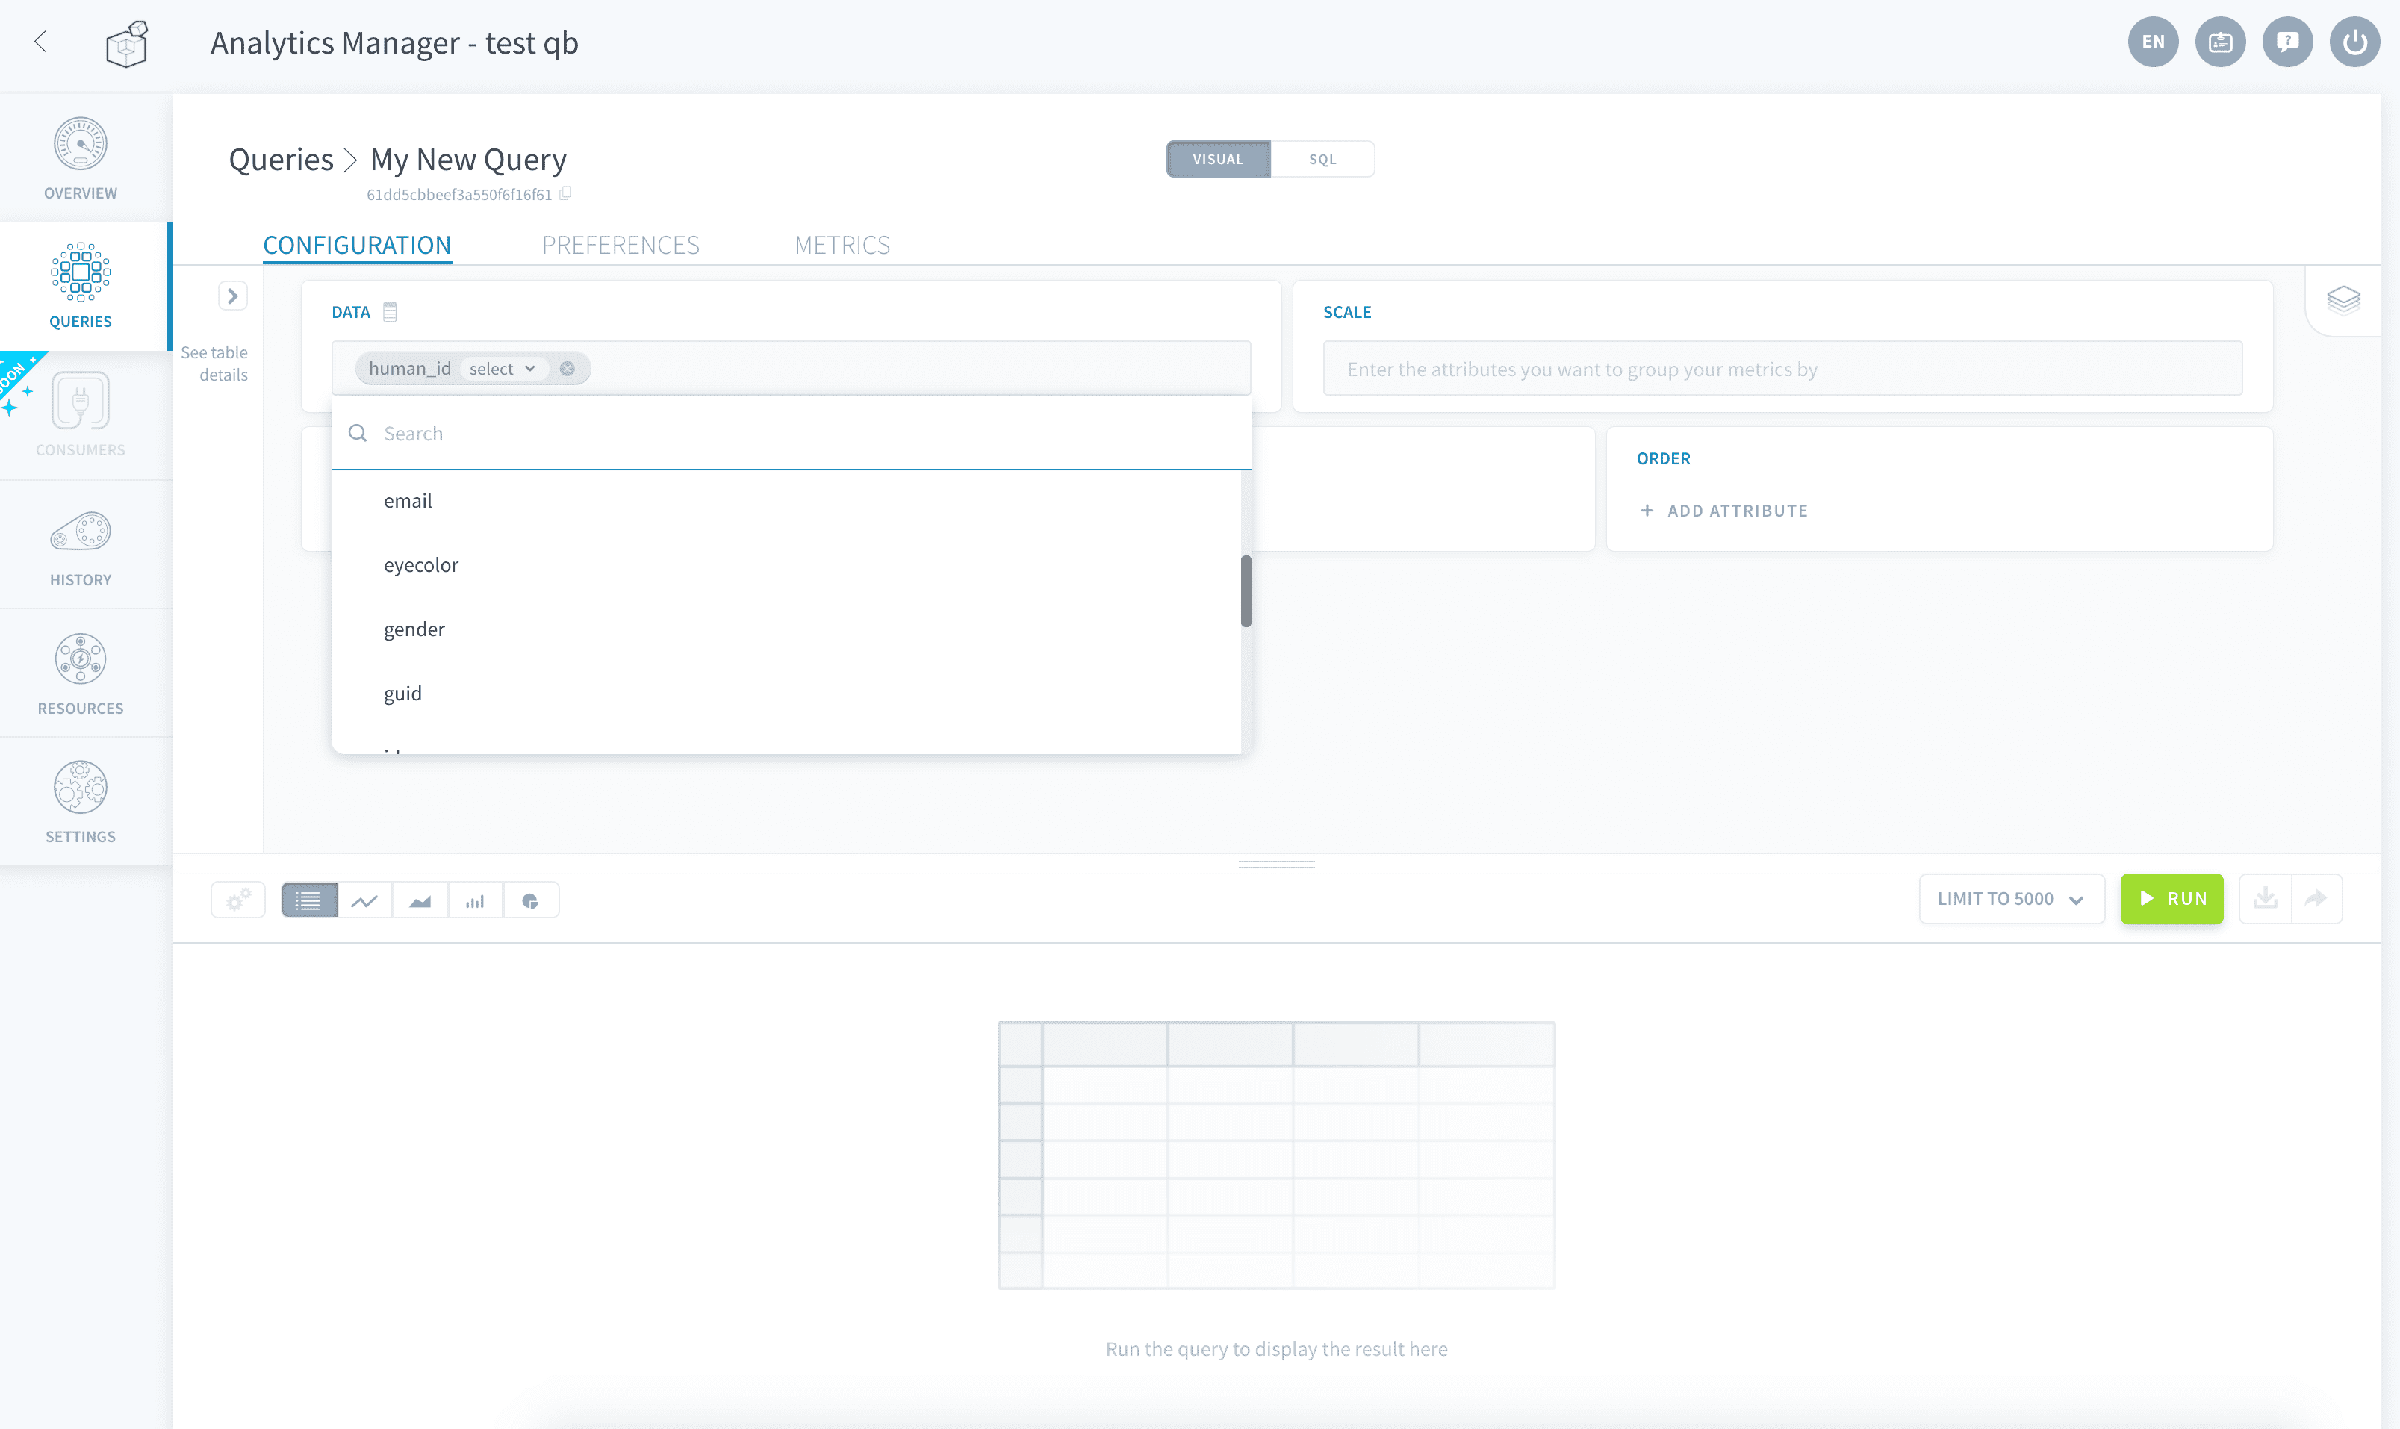
You can add as many attributes as you want as long as they exist in the same table, otherwise an error will be returned. The list of available attributes in the interface is automatically filtered to only display the other available attributes.
You don't need to specify the table. Use the widget to the left of the screen to get metadata about the tables and attributes you want to query.
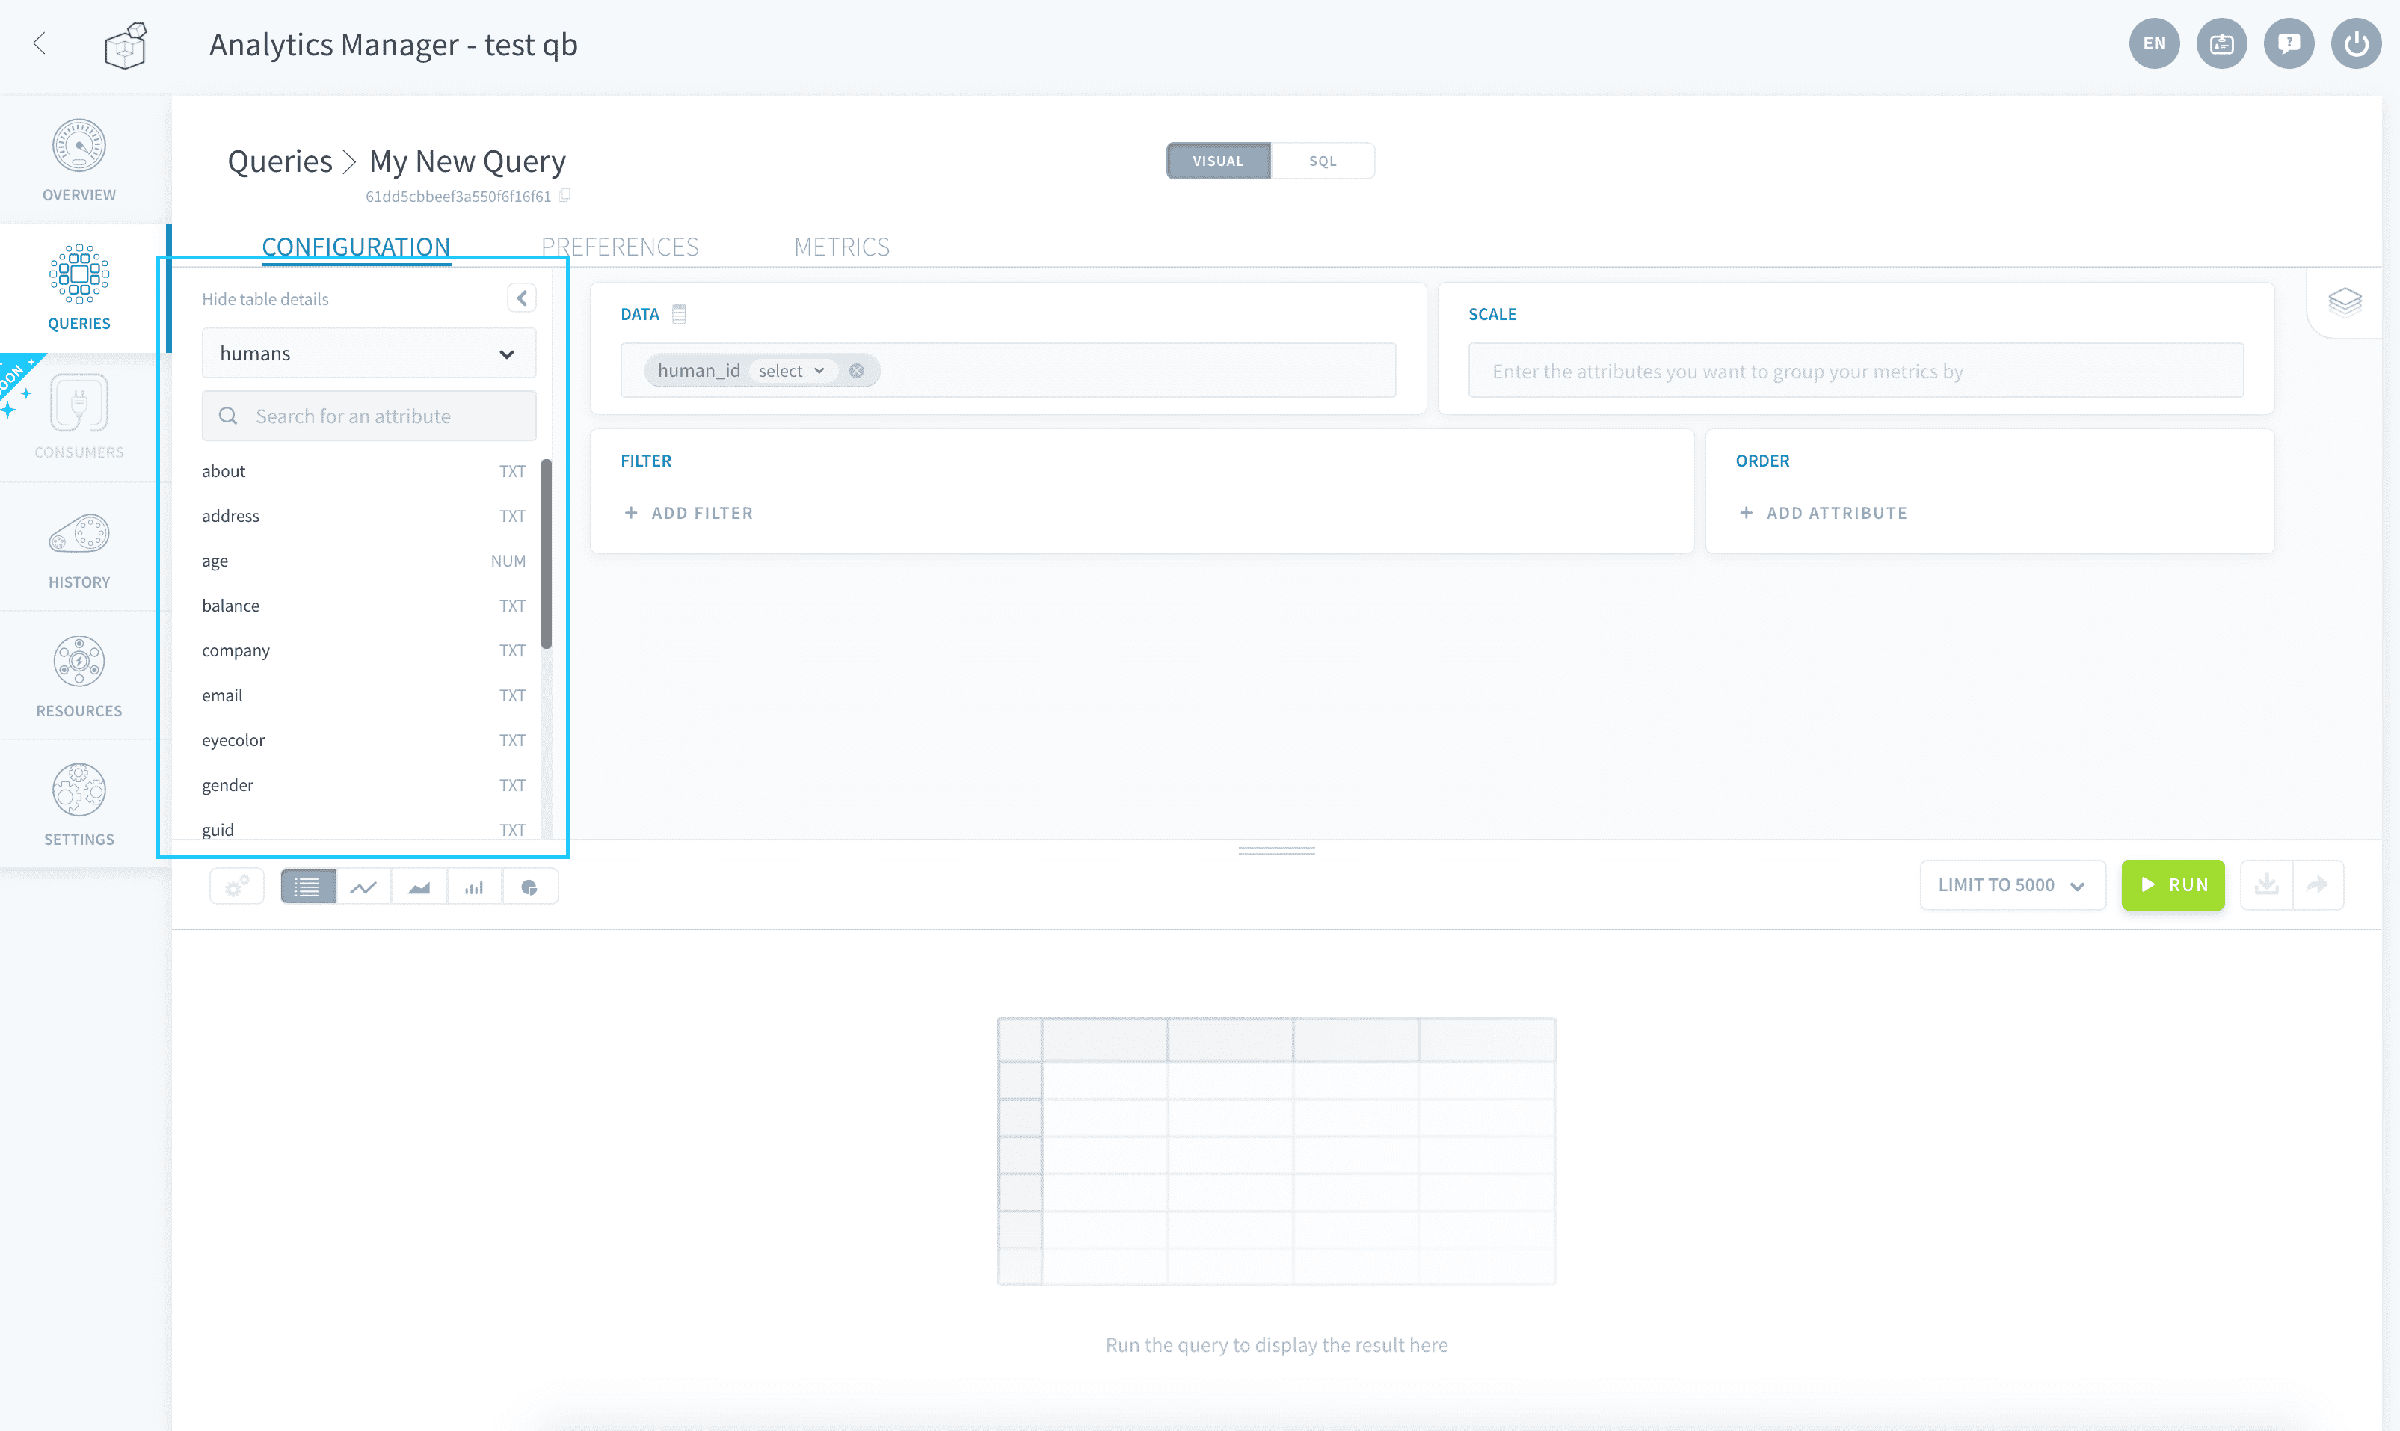
Aggregation functions
- SELECT: The SELECT function simply displays the value of the selected attribute. It will select the first value of the list if several values are returned.
- SUM: The SUM function is used to calculate the total sum of the values of an attribute.
- COUNT: The COUNT function is used to count the number of occurrences returned by the query.
- COUNT DISTINCT: The COUNT DISTINCT function is used to count the unique different values of an attribute.
- MIN & MAX: The MIN & MAX functions are used to display the minimum and maximum values of an attribute.
- SELECT DISTINCT: The SELECT DISTINCT function is used to display the unique different values of an attribute.
- AVG: The AVG function is used to calculate the arithmetic average of an attribute.
Choice of table
The visual builder does not ask you to specify a table. By default,the Platform determines the table that is the most fit for the query: it is the table containing all attributes in the data, scale, filter and order fields which has the least amount of rows.
If you want the query to be forced on a specific table, you can always override the system-automatically-chosen tables and select your own by clicking the table icon next to Data.
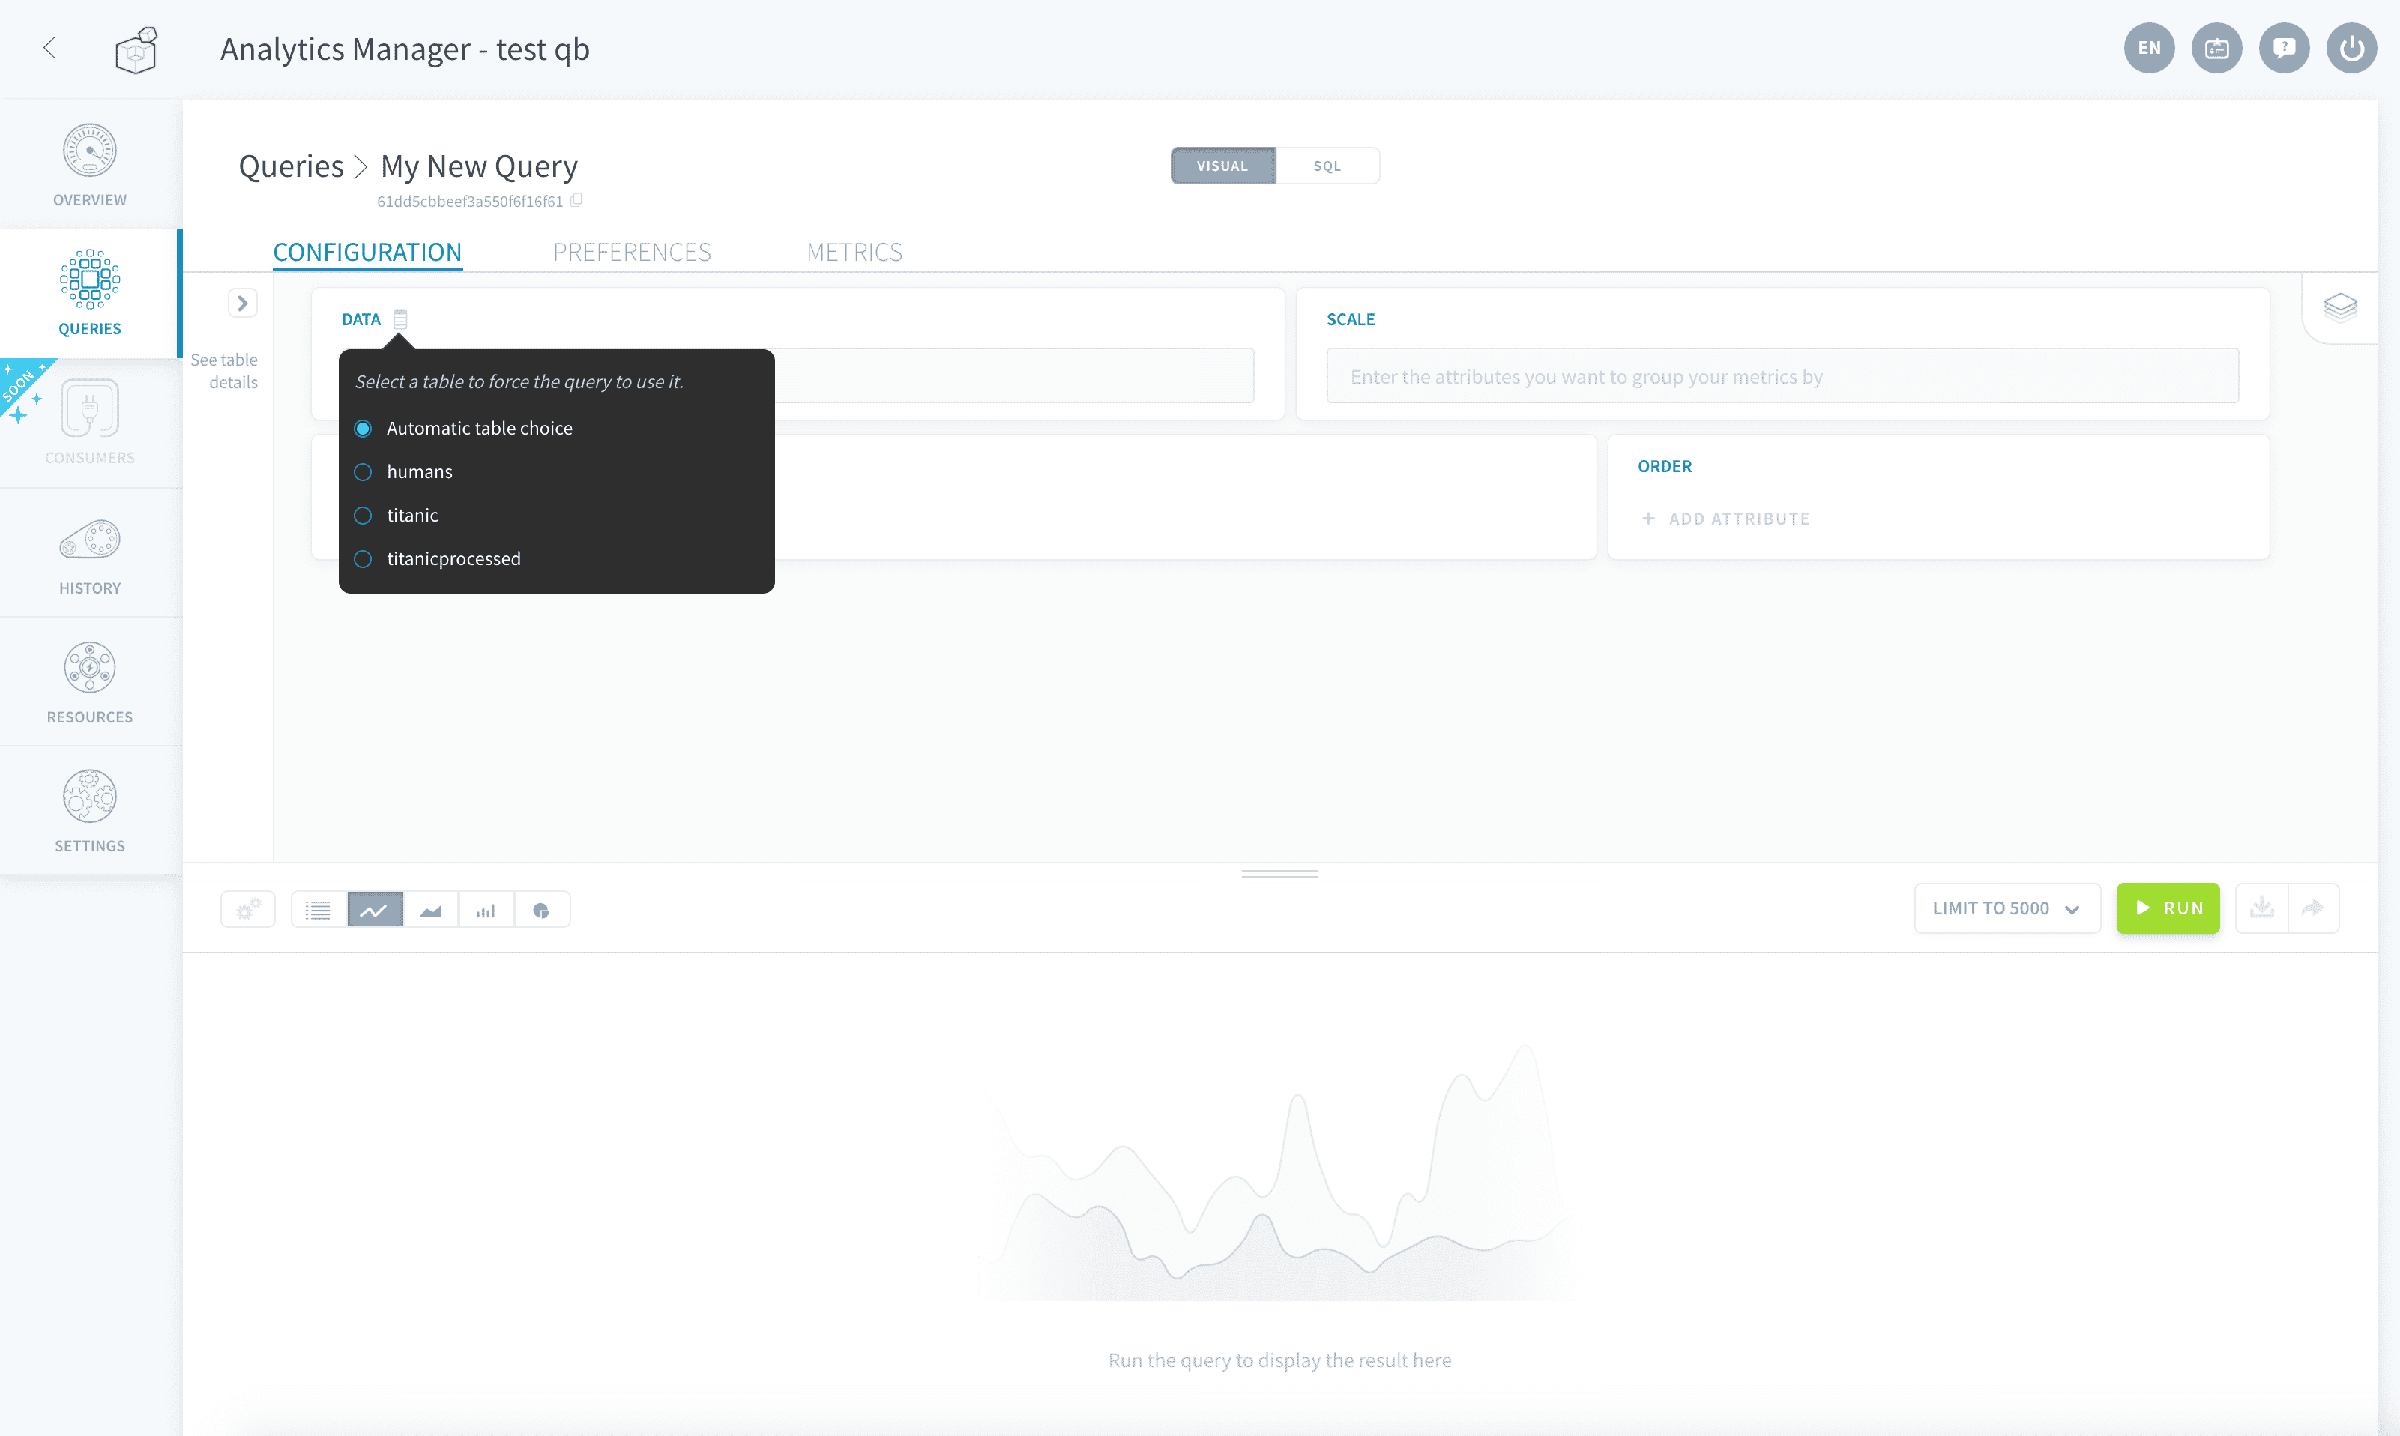
Forcing the queried table can come in handy when certain attribute names (such as "date") are common to a large number of tables. However, it is not a good practice as the Analytics Manager is designed to fetch the data using an optimal path to reduce runtime.
Configure the field Scale
In the field Scale, enter the attributes (usually dimensions) that you want to group your Data attributes (usually measures) by.
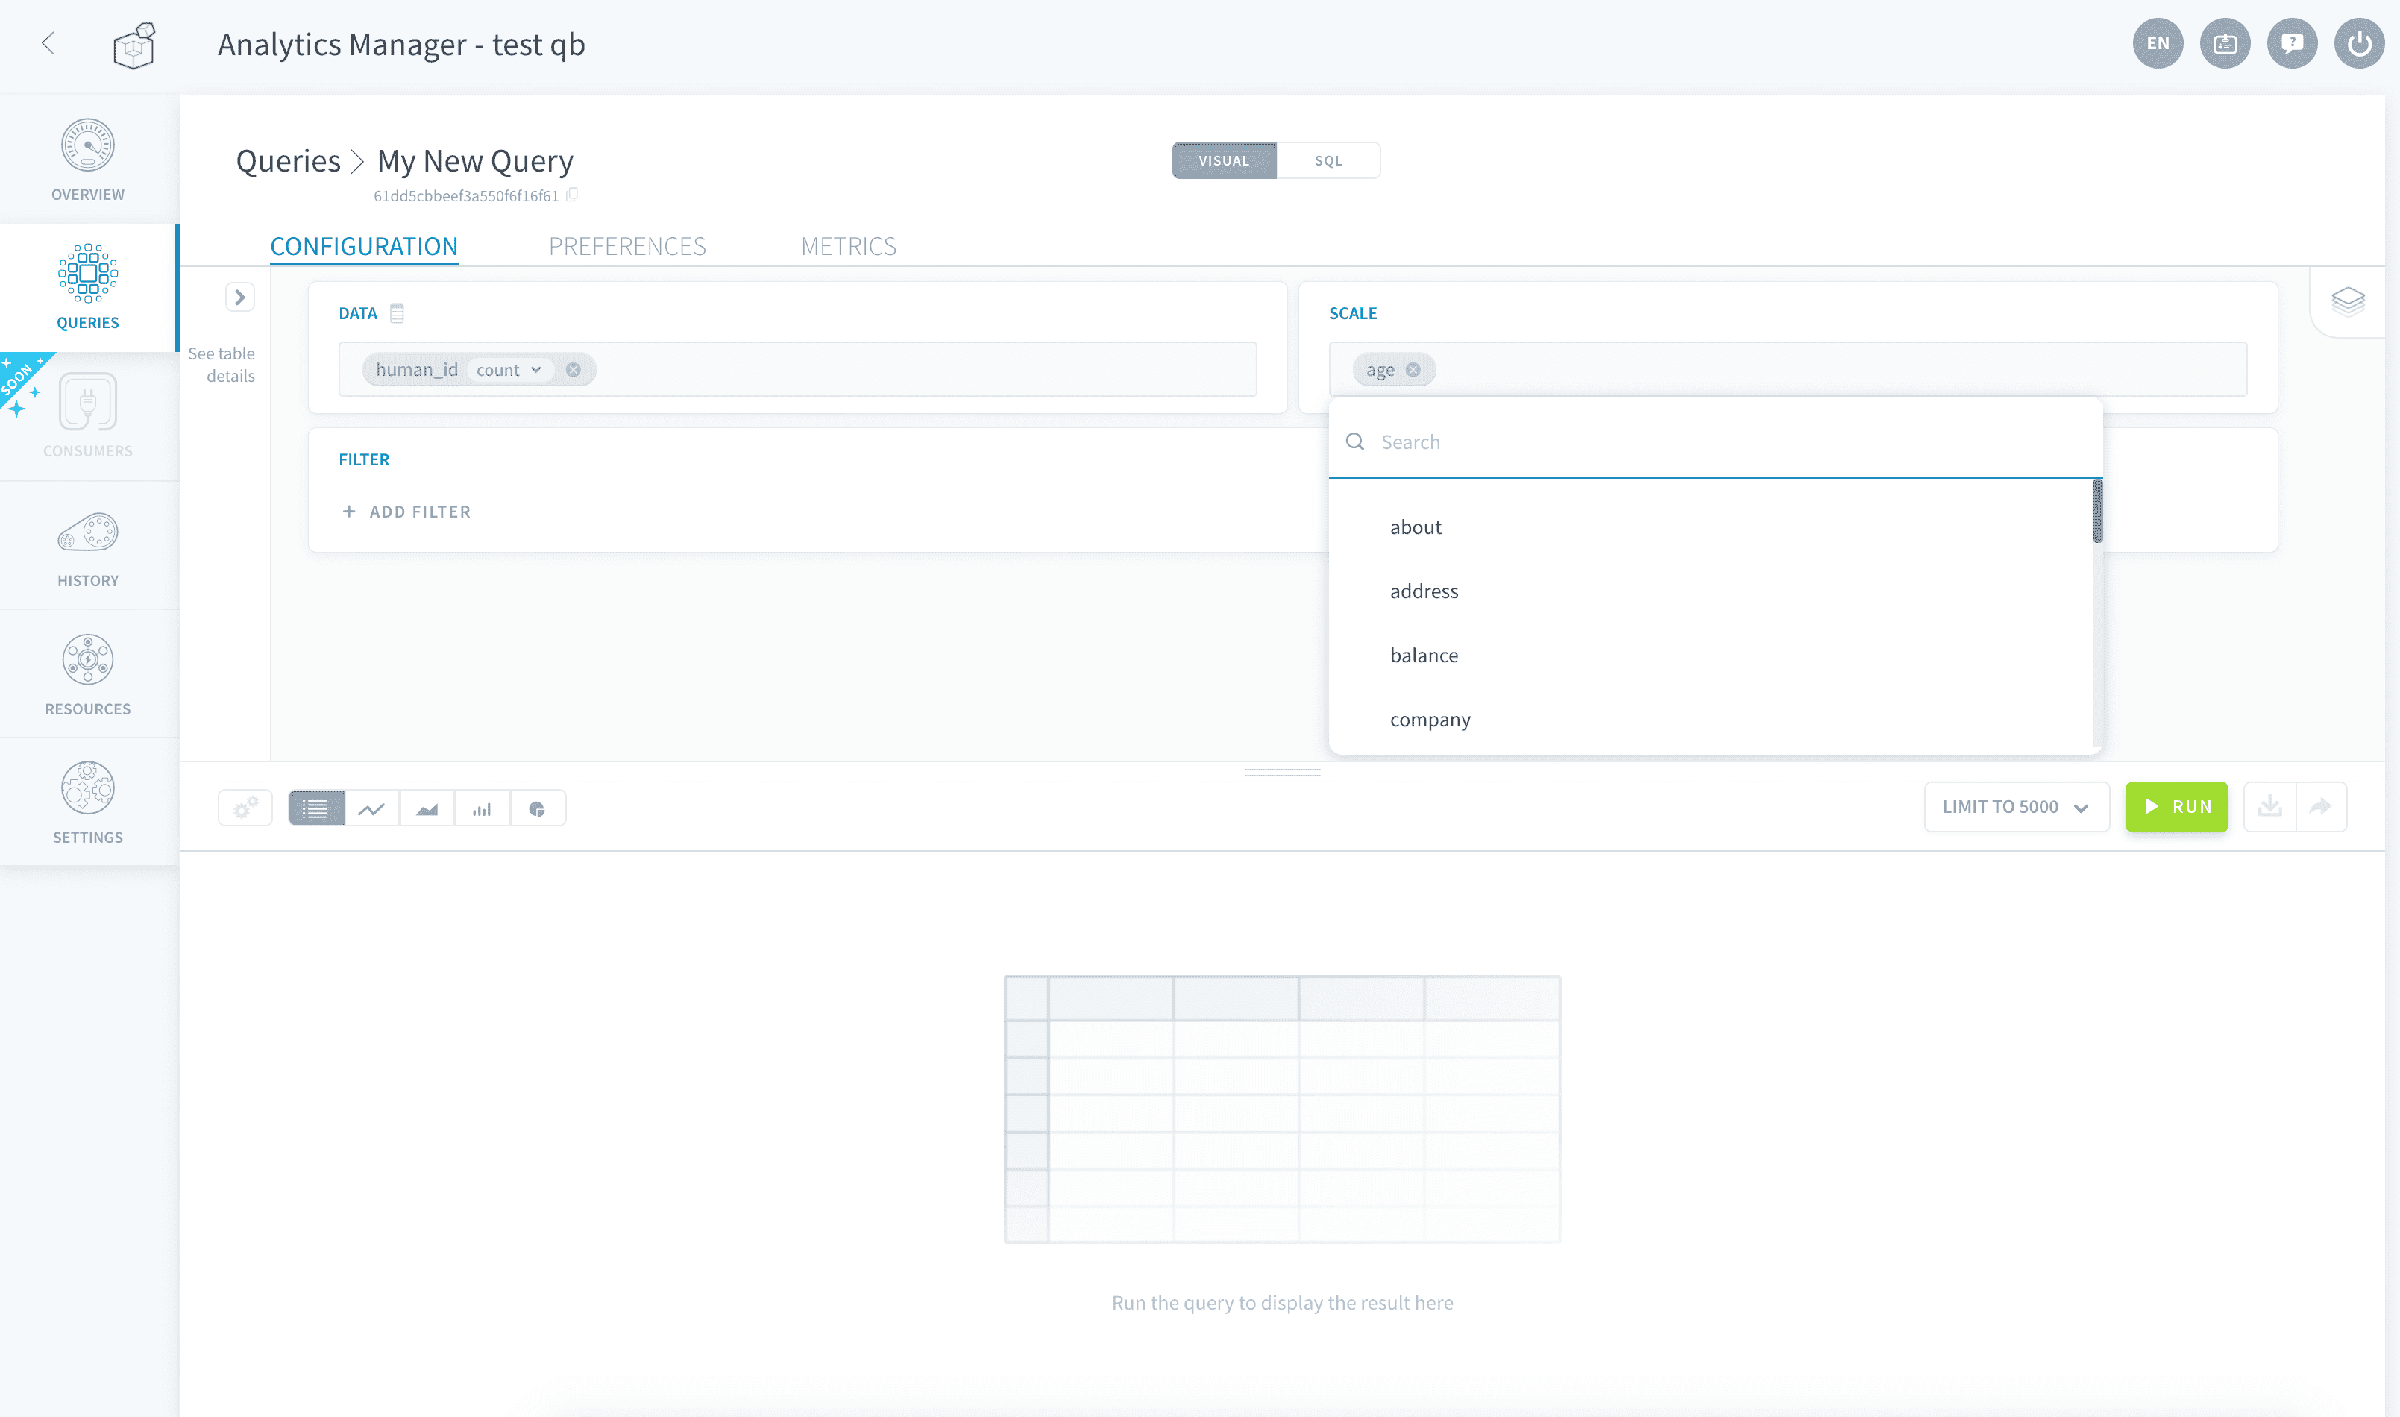
An example of use case is if the query needs to return the revenue amount per month or the revenue amount per store.
You can add as many attributes as you want as long as they exist in the same table, otherwise an error will be returned. The list of available attributes in the interface is automatically filtered to only display the other available attributes.
Configure the field Filter
This parameter is used to apply filters to the values that the query is expected to return.
Filters are particularly useful to prevent nulls or unlabeled values to be displayed or taken into account.

Enter the reference values for string-datatype filters as is, without the " " around the string. Enter the reference values for numeric-datatype filters as is too.
Use the widget panel "See table details" to the left of the screen to check the type of the attributes to use as filters.
Below is the list of all filter options available:
- Equal - Value is equal to reference.
- Not equal - Value is not equal to reference.
- In - Value contained in reference list (press Enter to add a value to the list).
- Not In - Value not contained in reference list (press Enter to add a value to the list).
- Greater than (>) - Value is greater than a reference.
- Greater than equal (>=) - Value is greater than or equal to a reference value.
- Lower than (<) - Value is lower than a reference value.
- Lower than equal (<=) - Value is lower than or equal to a reference value.
- Between - Value is between 2 values.
- Not between - Value is not between 2 values.
- Null - Value is null.
- Not null - Value is not null.
- Like - Substring of value is contained in reference value (formatted using SQL LIKE syntax).
- Not like - Substring of value is not contained in another reference value (formatted using SQL LIKE syntax).
Configure the field Order
This parameter is used to order the results returned by the query based on the order of values of one or more fields, in ascending or descending order.
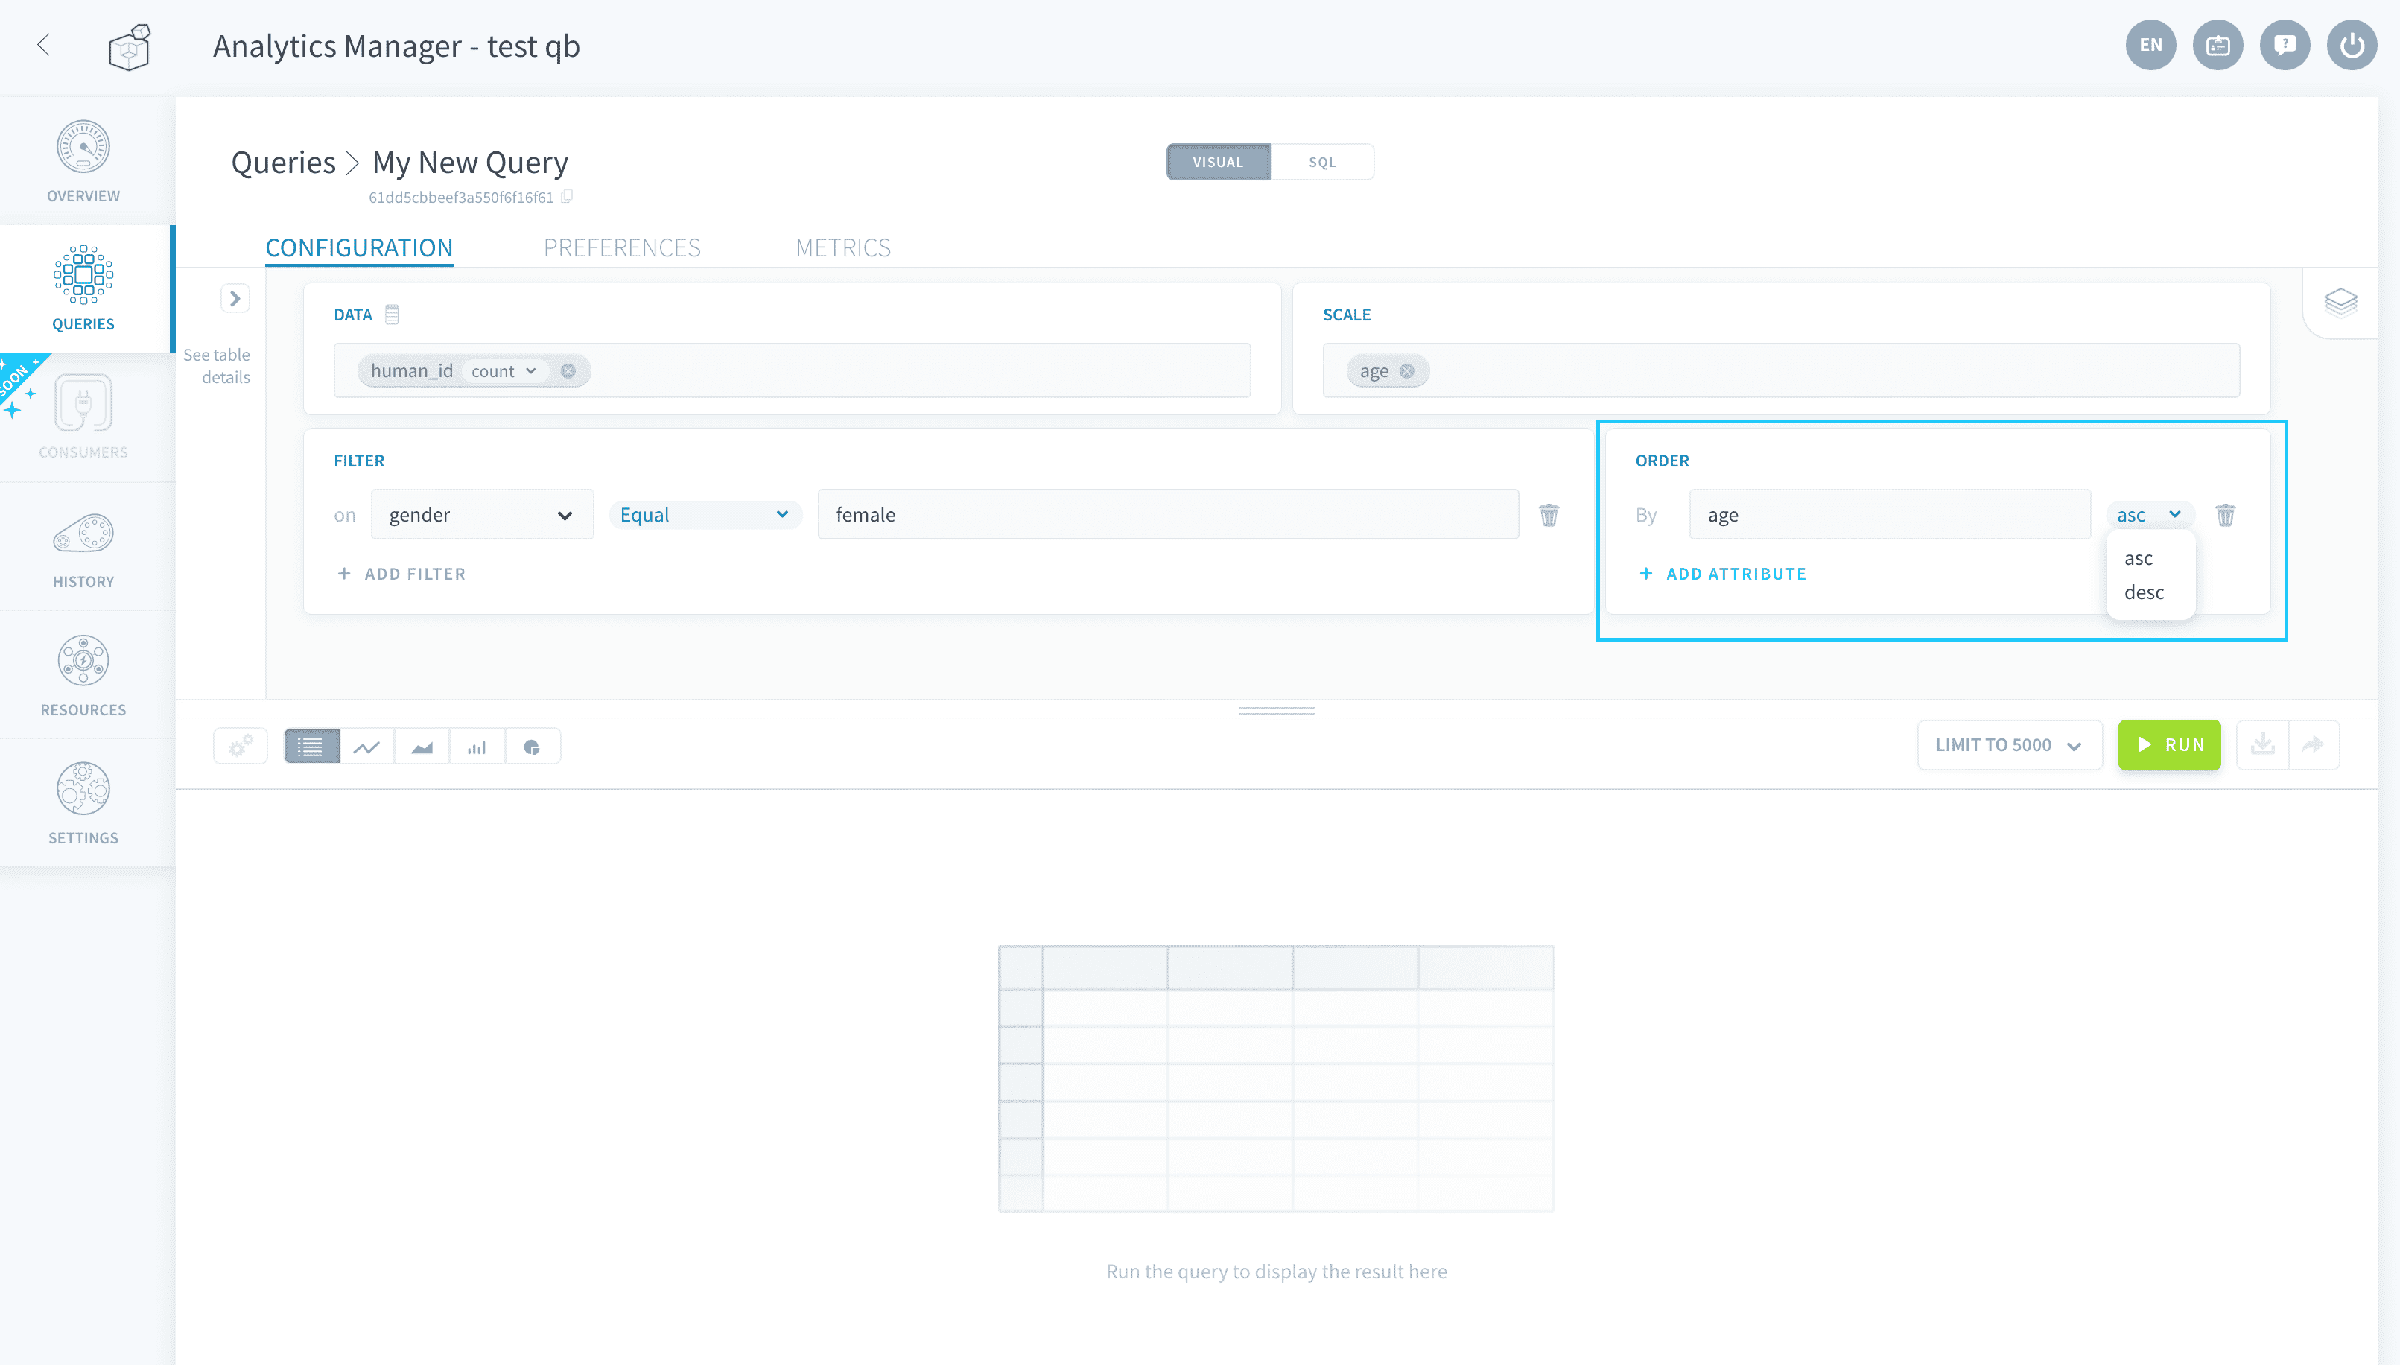
Attributes in the Scale field are not added to the Order field by default, in order to optimize runtimes.
Discover the response format
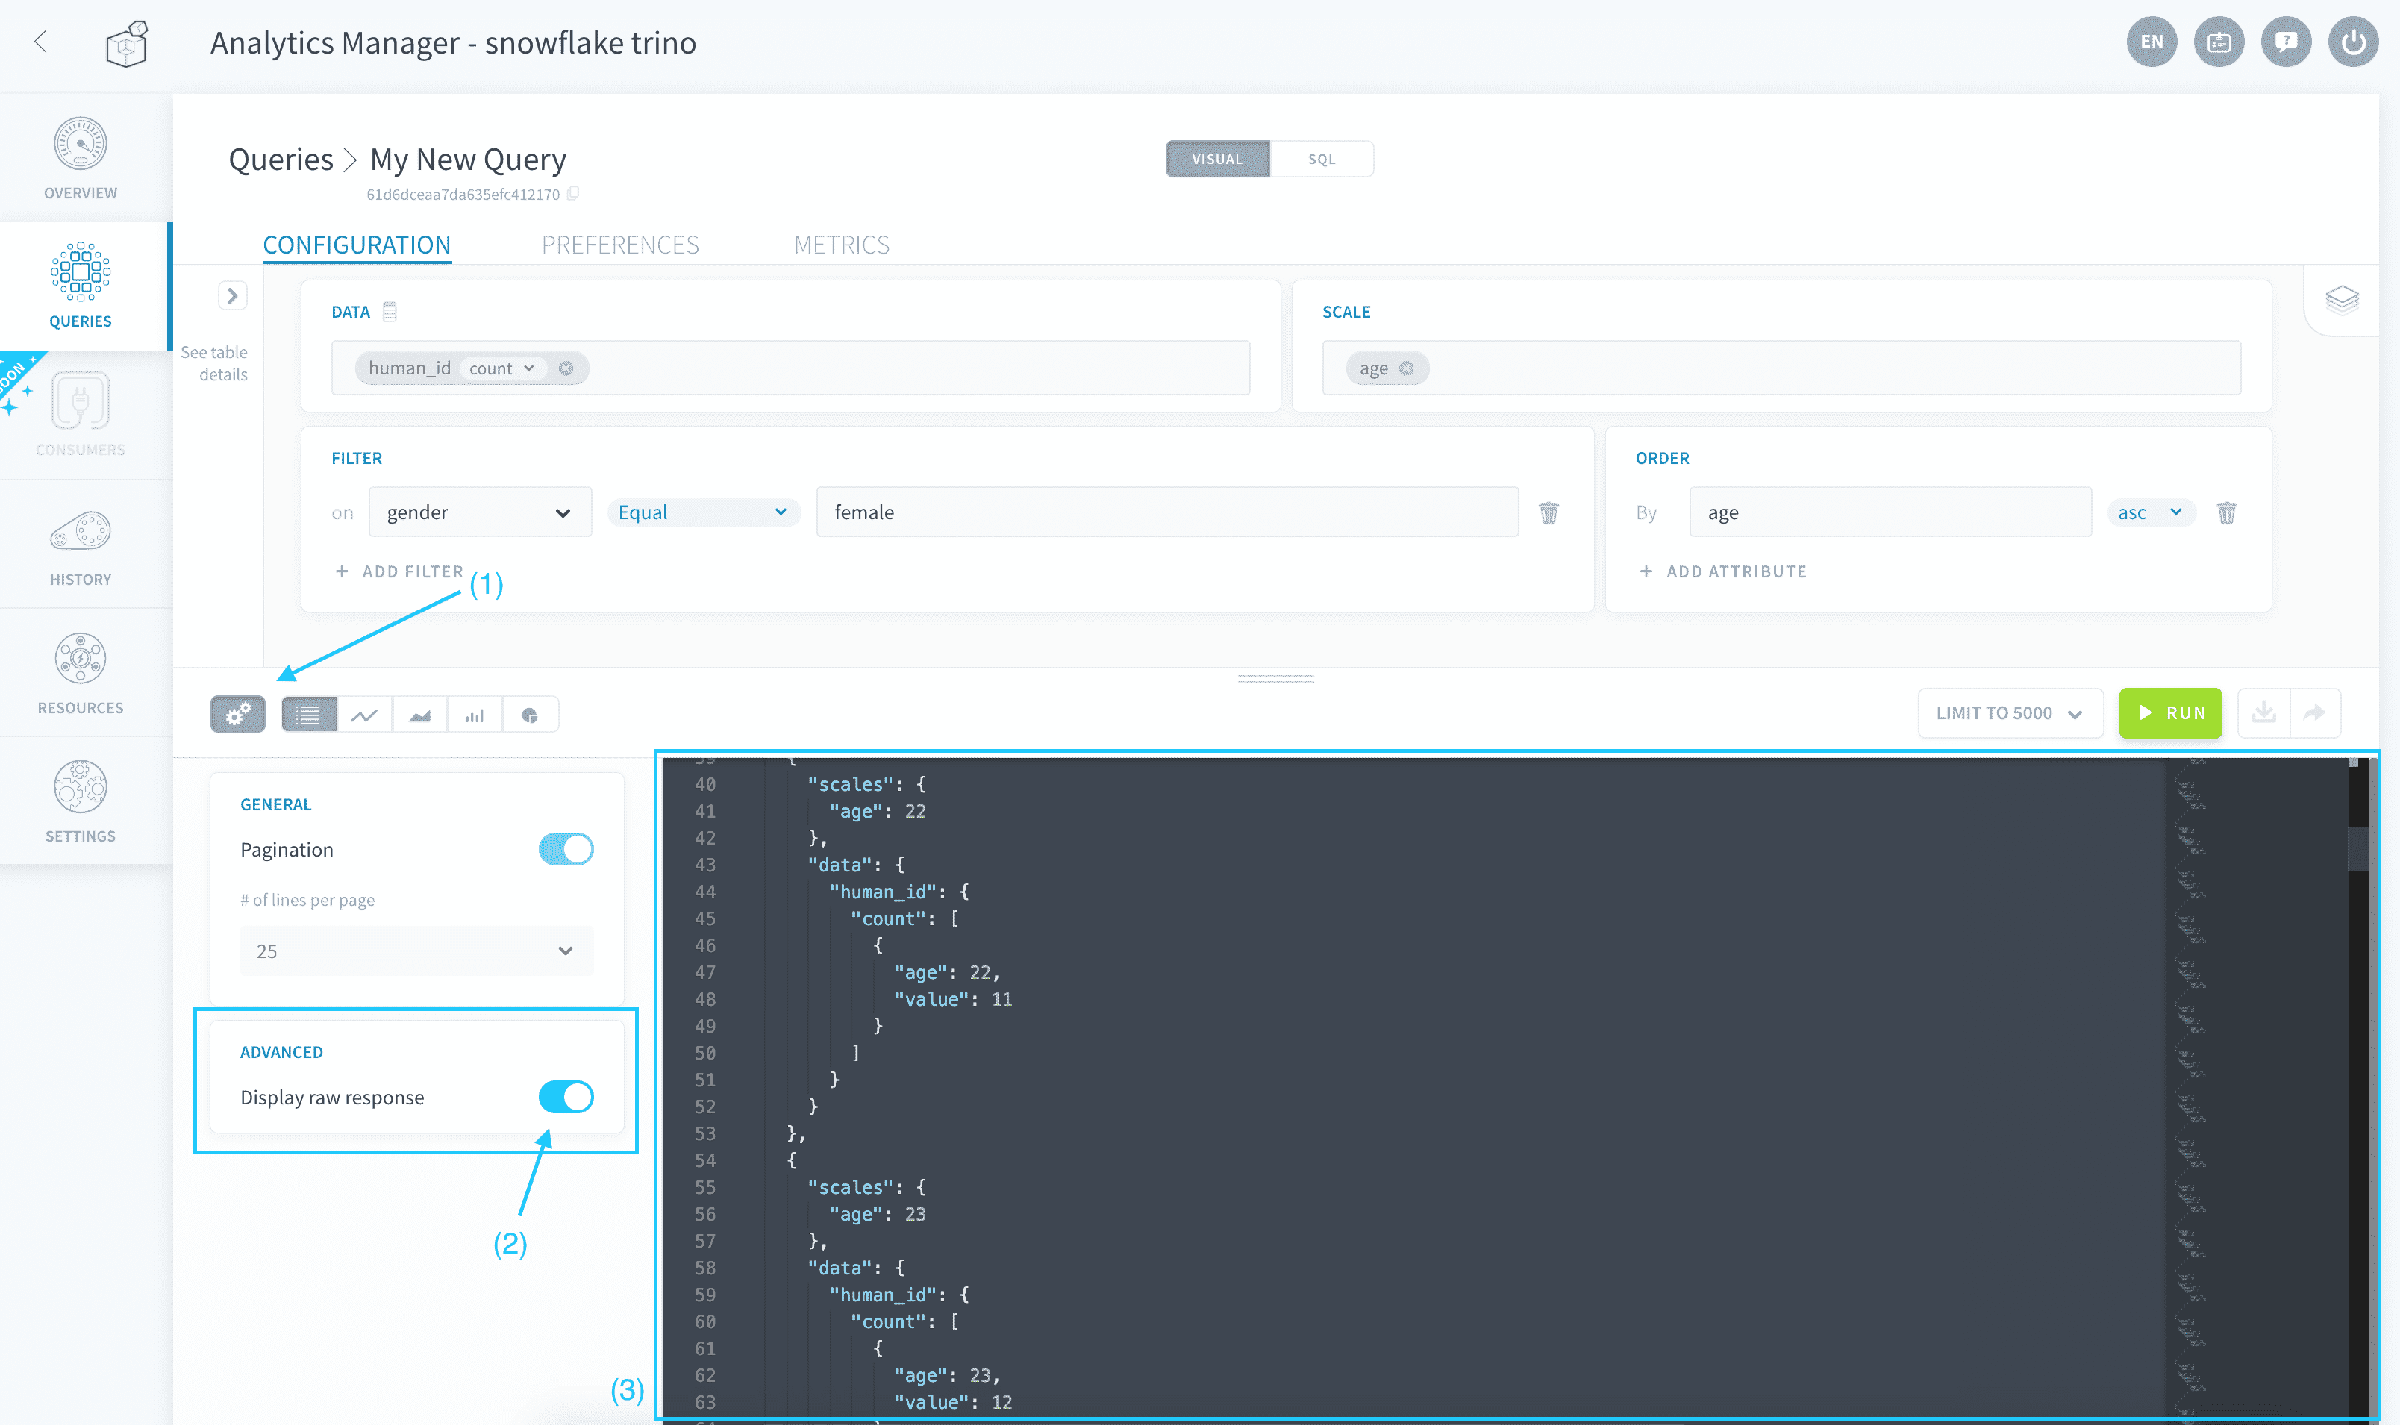
When a query is executed through the visual mode, the results are returned using the following format.
To view the raw response sent by the Analytics Manager when your query is executed, visualize the results as a table. Then click on the gear icon and activate Display raw response.
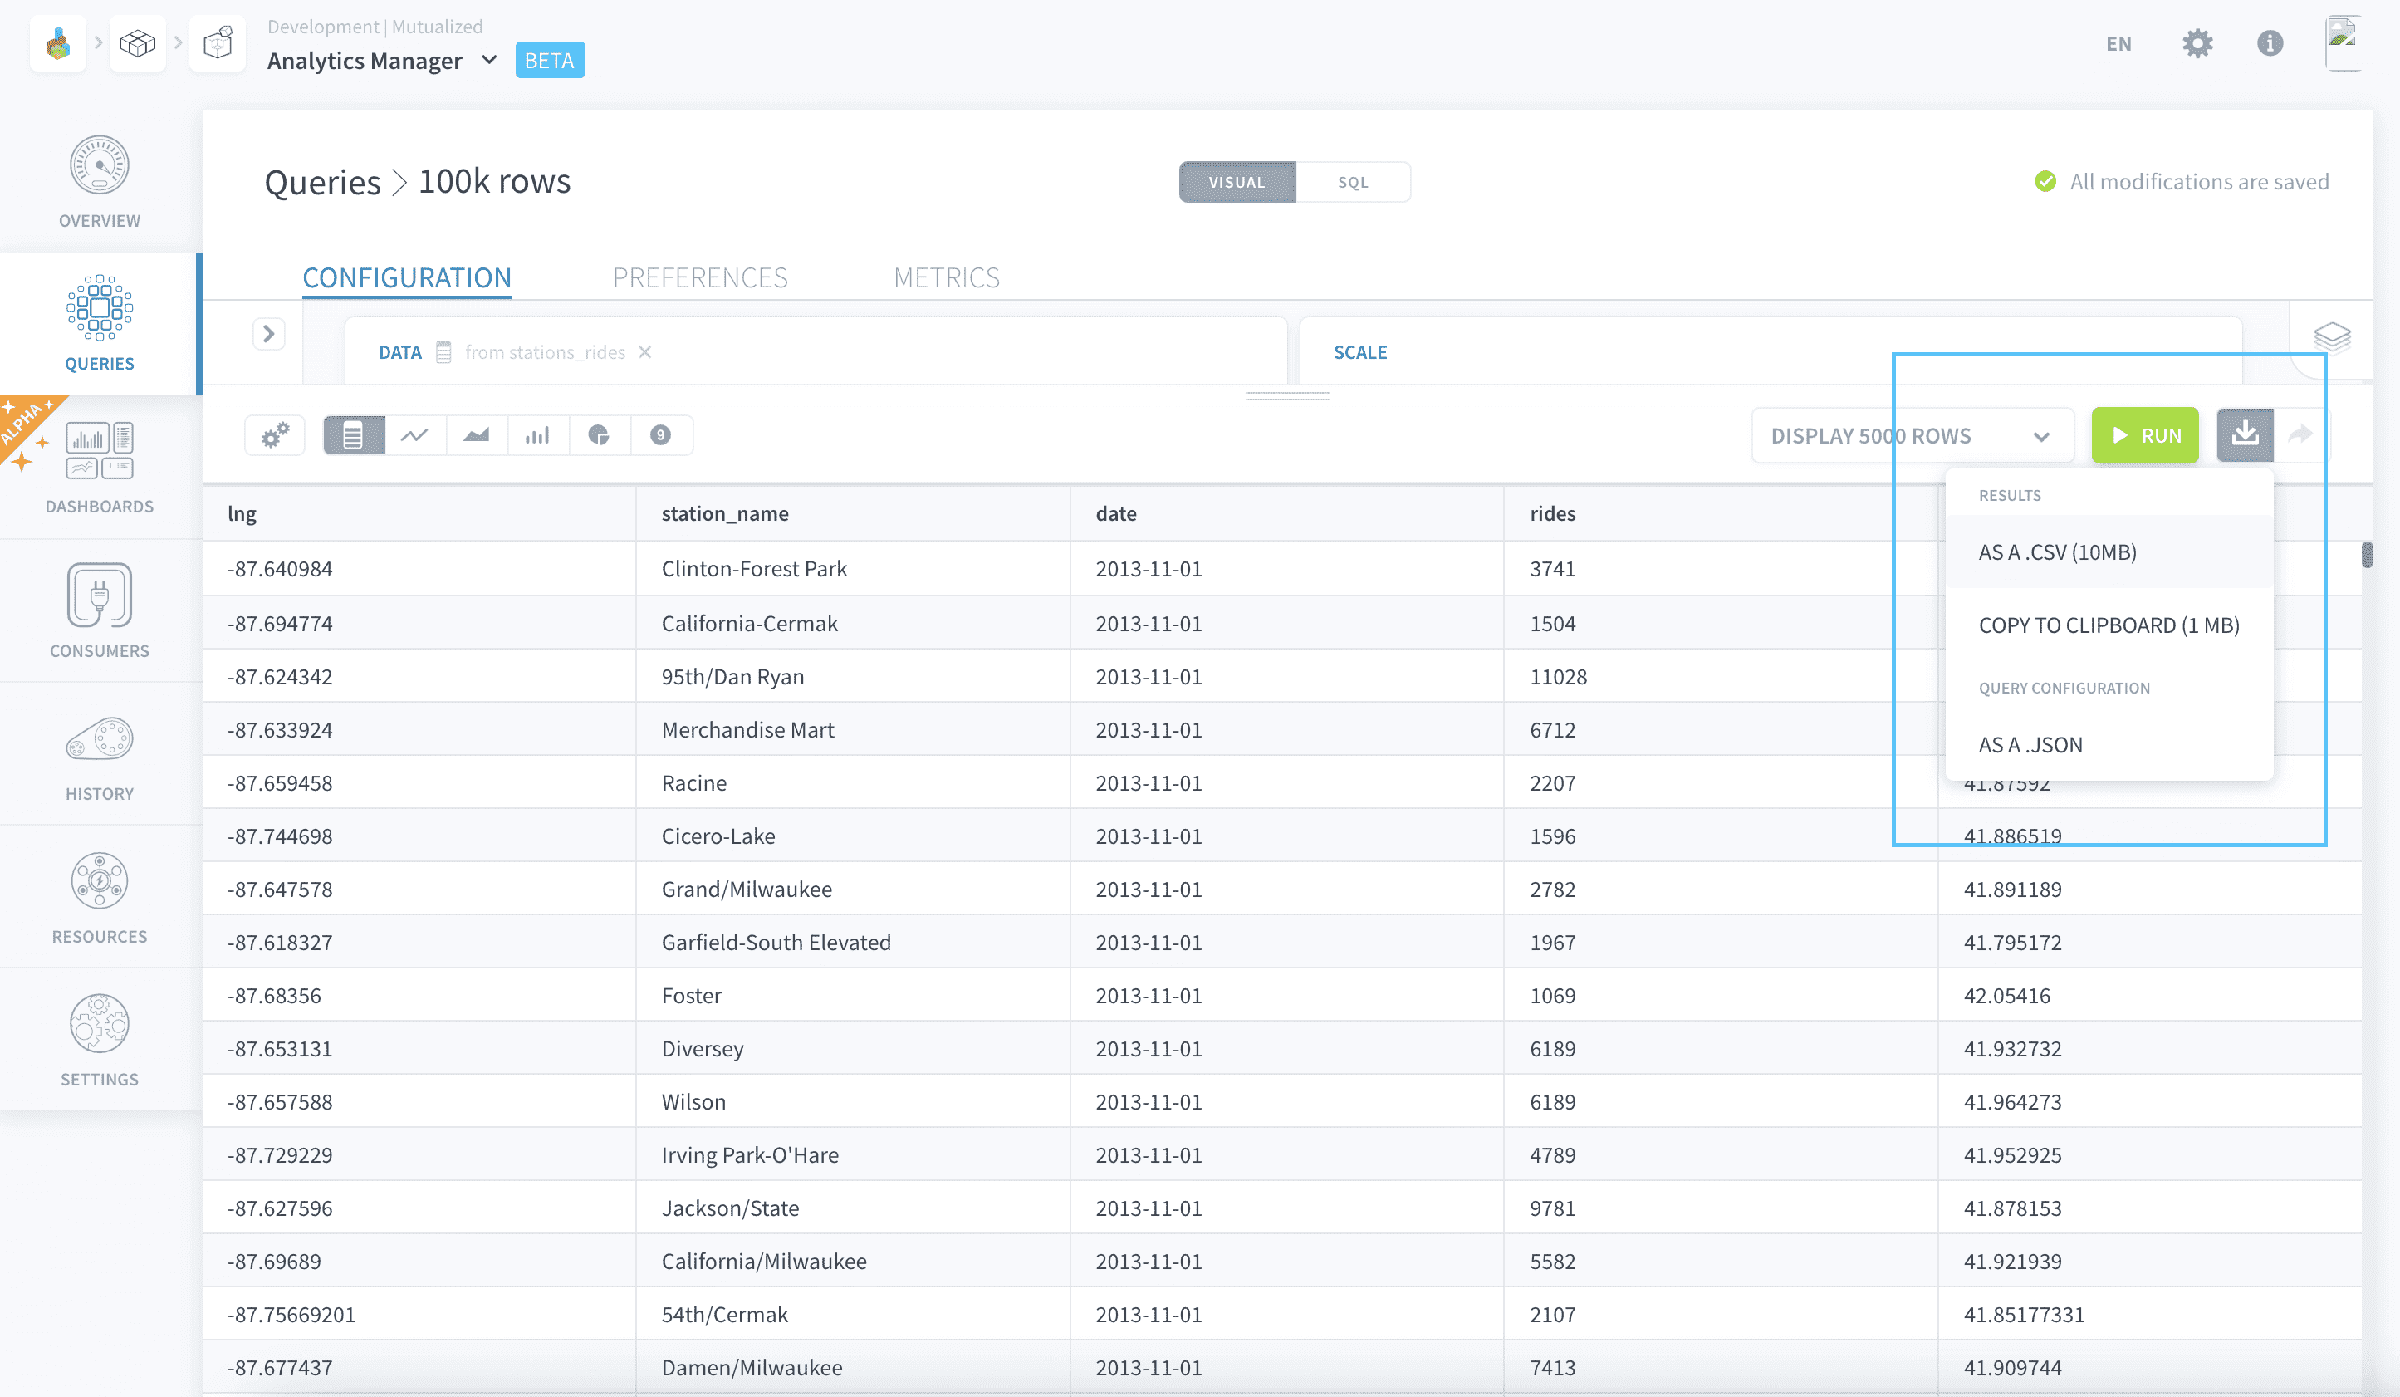
Finally, it is possible to export the query results in various different formats (such as a .csv, copying tab-separated values, etc.) by clicking on the Download button next to the Run button.
Go further
If you need training or technical assistance to implement our solutions, contact your sales representative or click on this link to get a quote and ask our Professional Services experts for a custom analysis of your project.
Ask questions, give your feedback and interact directly with the team building the Data Platform on the dedicated Discord channel.
If you need support with your OVHcloud services, create a request in our Help Centre.
Join our community of users.