

Add content to a dashboard
Dashboards are made up of the following elements: You can add as many tiles and filters as you want to a dashboard
Objective
Dashboards are made up of the following elements:
- A title and description
- Filters
- Chart tiles
You can add as many tiles and filters as you want to a dashboard.
Arrange tiles
Tiles are the main constituting elements of dashboards. Each tile contains a chart saved as a query, along with a title and a story.
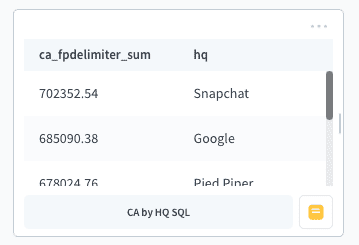
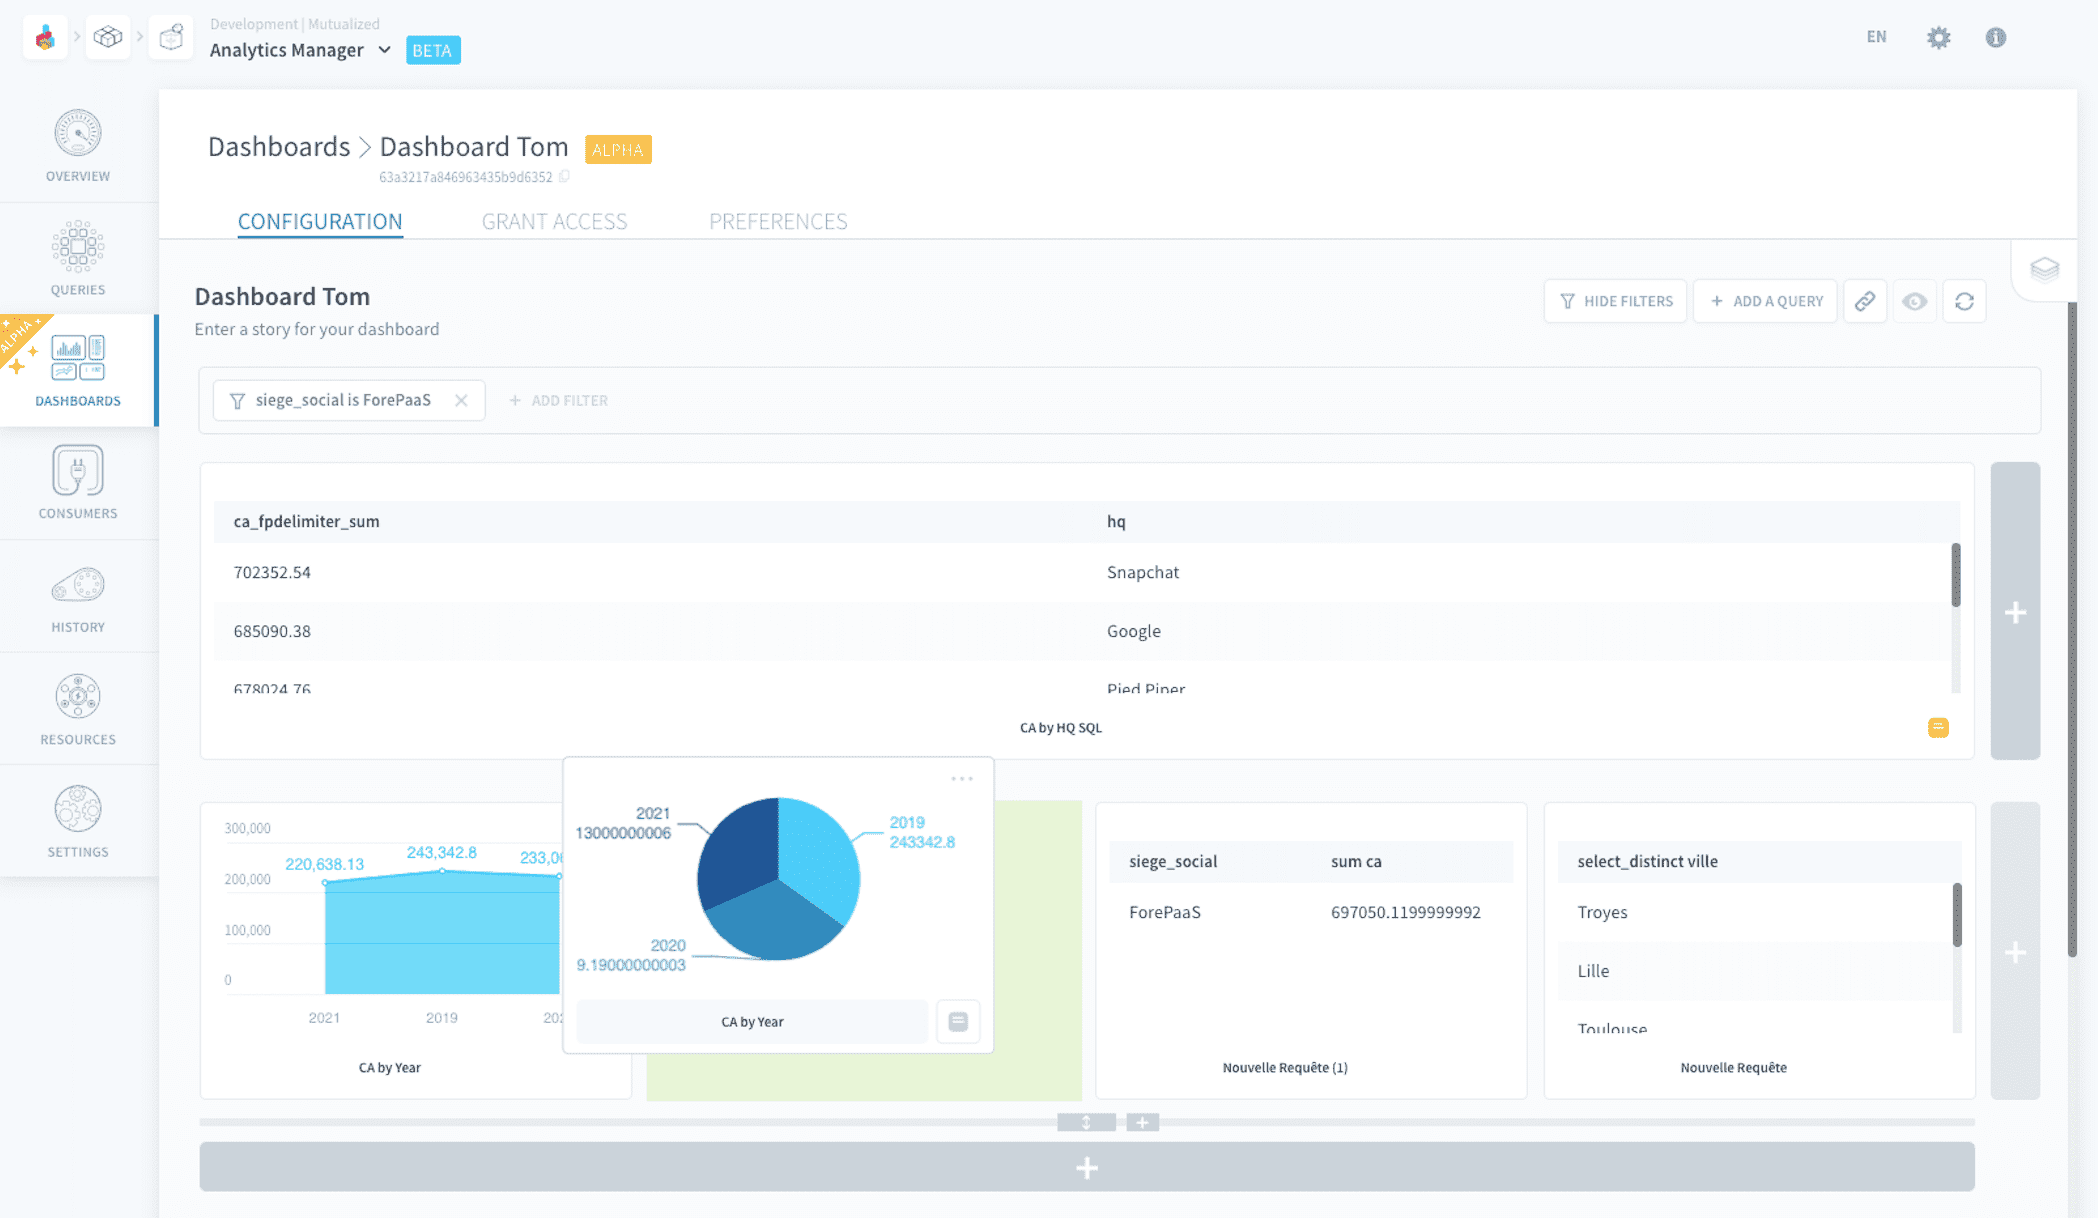
Tiles can be moved around by dragging and dropping them. They are naturally positioned in successive rows. There cannot be more than 8 charts on the same row.
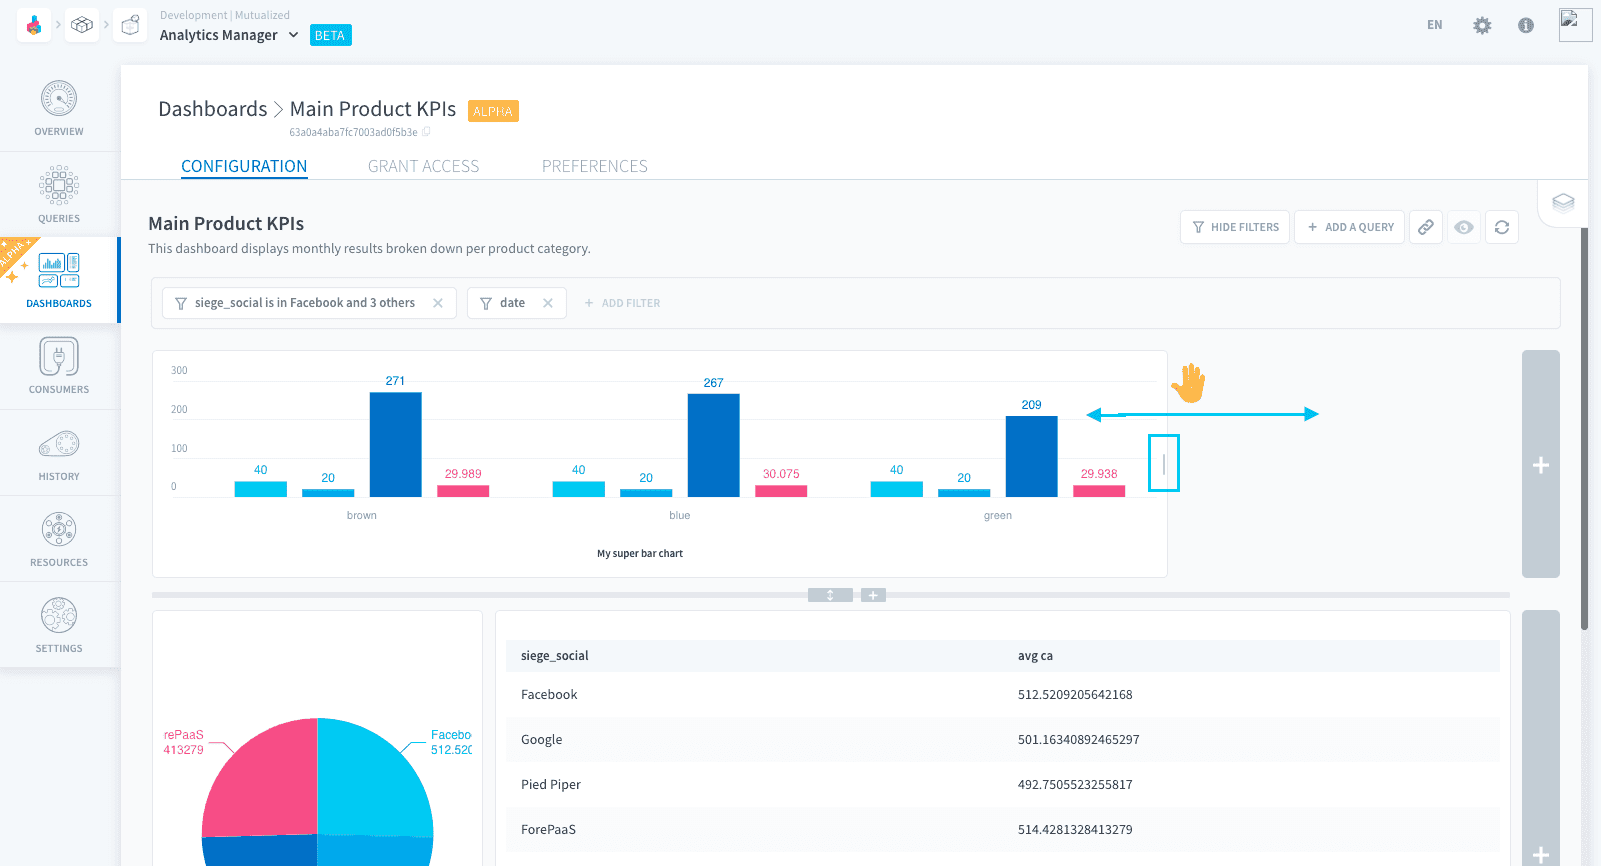
Resize a tile
Tiles can be resized horizontally by drag-dropping the little handles on the right and left.
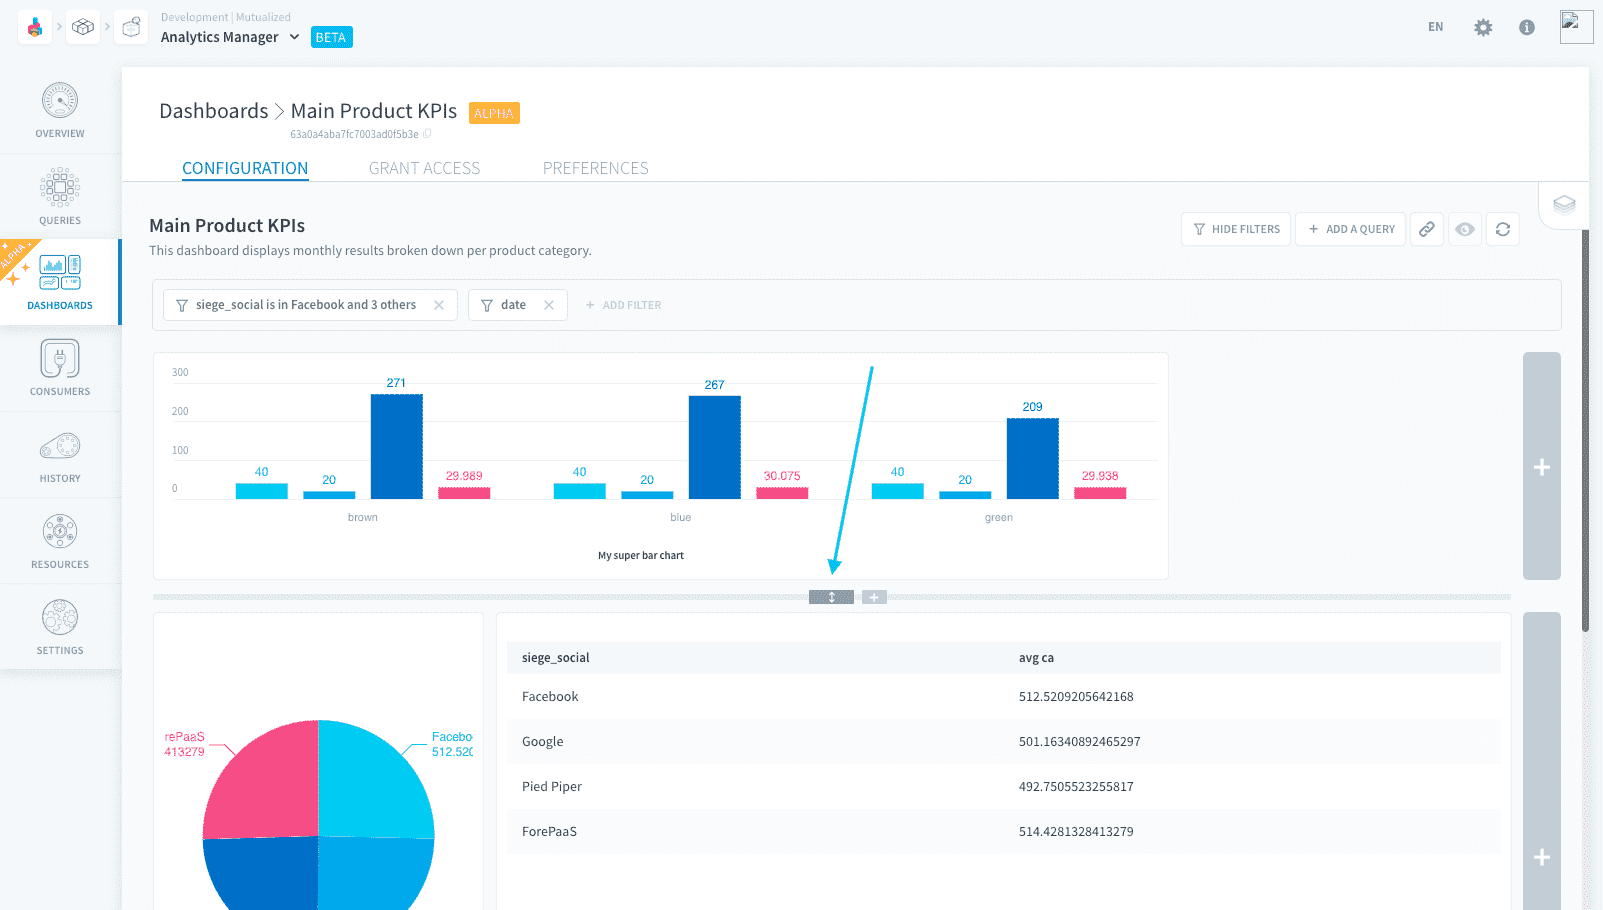
Tiles can be resized vertically by drag-dropping the main handle under each row. Note that this resizes the whole row.
Change a tile's visualization settings
Tiles are linked to a saved query which gives:
- the result of the query
- a default visualization type and its settings
However, it is sometimes useful to bind two different tiles to the same query, using two different visualization modes.
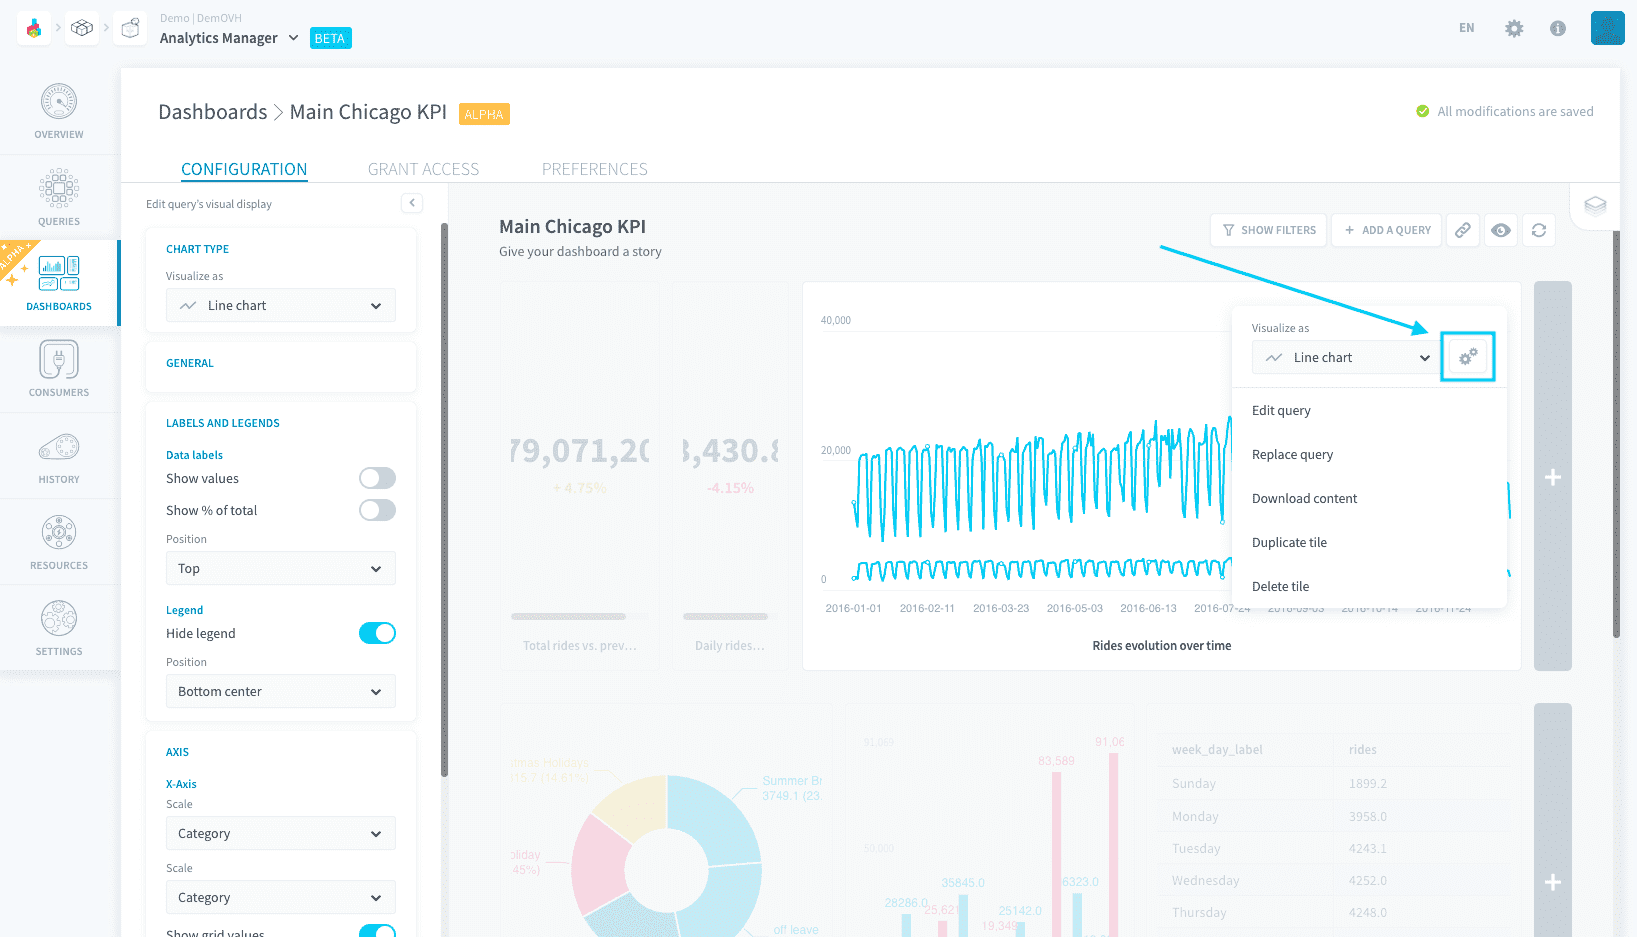
The visualization type can be overridden in each tile by clicking on the corresponding chart type in the tile's settings.

This will use the visualization options (such as axis or label settings, etc.) set at the query level. You can edit them here by clicking on the gears icon.
Add data stories
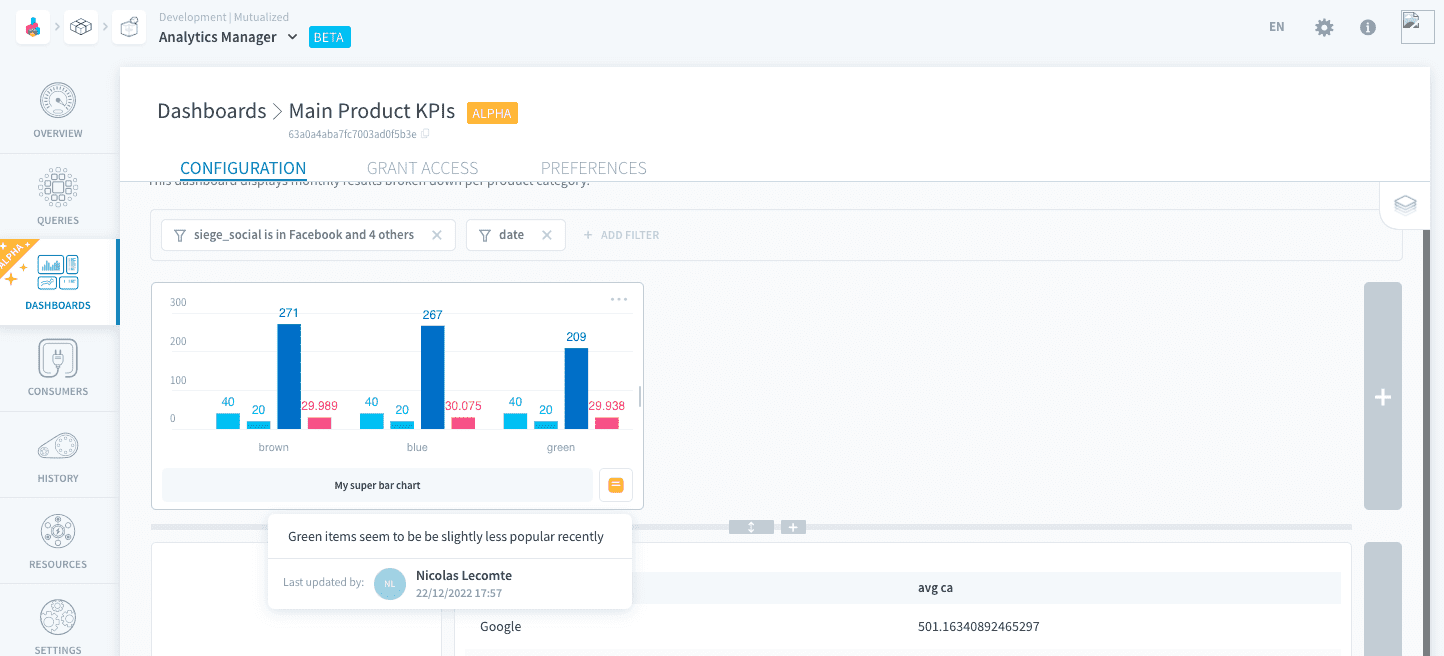
Stories allow you to add a summary, conclusion, special observations to note, or simply comments about a chart.
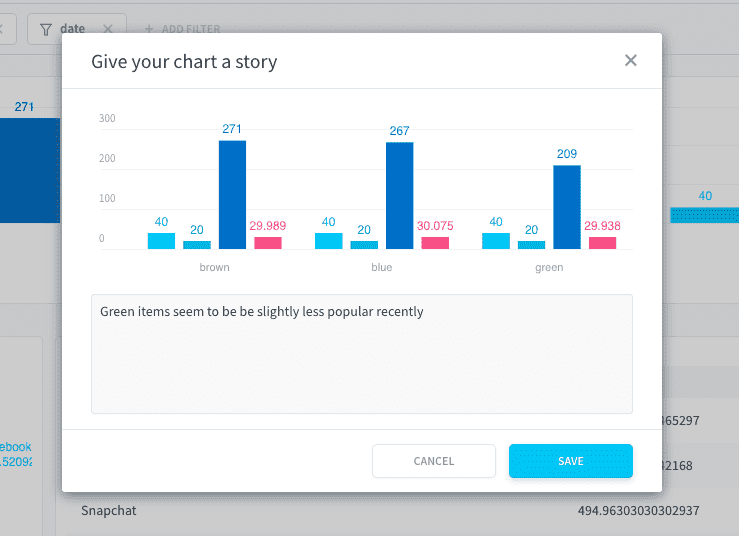
Future users can hover over the story icon to read it. Click on the icon to edit the story.
Create filters
You will probably experience a situation where you need to create multiple versions of the same dashboard, but with only one variable changed.
For example, you may have a retail report which you need to show for multiple store IDs. Rather than creating dozens of copies of the dashboard, you can add filters to allow users to filter the queries in the tiles within a single dashboard.
Add and use a filter

Adding a variable to filter on makes it available in the live dashboard. Users accessing the live dashboard will be able to change the variable of the filter (but not remove or add a new variable to filter on).
Filters can take up various formats: dropdown menus, date pickers, etc... This is managed in the advanced filters options.
The default value of the filter in the live dashboard is the value saved in the edition mode of the dashboard.

Filters set on a dashboard are applied on top of the filters set at the query level.
For example, a chart which is filtered on country is in [Japan, USA] at the query level, and which is added to a dashboard containing the filter country is not Japan will be displayed filtered on the country USA only.
Exception: Filters set on the same attribute and using same operator but with a different value in the query and the dashboard are the only situation where the dashboard filter overrides and replaces the query filter.
Force tiles to ignore a filter
By default, new filters are applied on all queries (i.e. charts) of the dashboard, except on queries which are written in custom SQL - which cannot be filtered as of now.
It is possible to force a tile to ignore a filter, either from the filter advanced options or from the tile itself.

Filters can be detected as irrelevant for a tile's query, meaning that filtering on any value for this filter will return no data for the query. They are flagged as such in the interface and it is recommended to ignore the filter at the tile's level.
Edit advanced filter options
The advanced filter options allow you to:
- Set the type of filter: dropdown menu, date picker, etc.
- Manage the tiles which ignore this filter.
- Check the page for the attribute of the filter
Click on the gear icon in a filter's header to open its advanced options.

By default, the type of a filter is automatically inferred when it is created.
- Categorical: choose among the possible values for the attribute. The possible values for each filter are rendered by a query saved automatically in a subfolder in the Queries tab.
- Date: use a datepicker to select a date range. This type is automatically set when the attribute appears as a Date in the Lakehouse Manager.
- Date & Time: use a timepicker to select a date and/or time range. This type is automatically set when the attribute appears as a Datetime in the Lakehouse Manager.
- Boolean: choose between True/False. This type is automatically set when the attribute appears as a Boolean in the Lakehouse Manager.

Drill down on the dashboard
Click on a part of a chart to reveal a range of options letting you explore your data further, such as dynamically filtering all the other charts on a value.
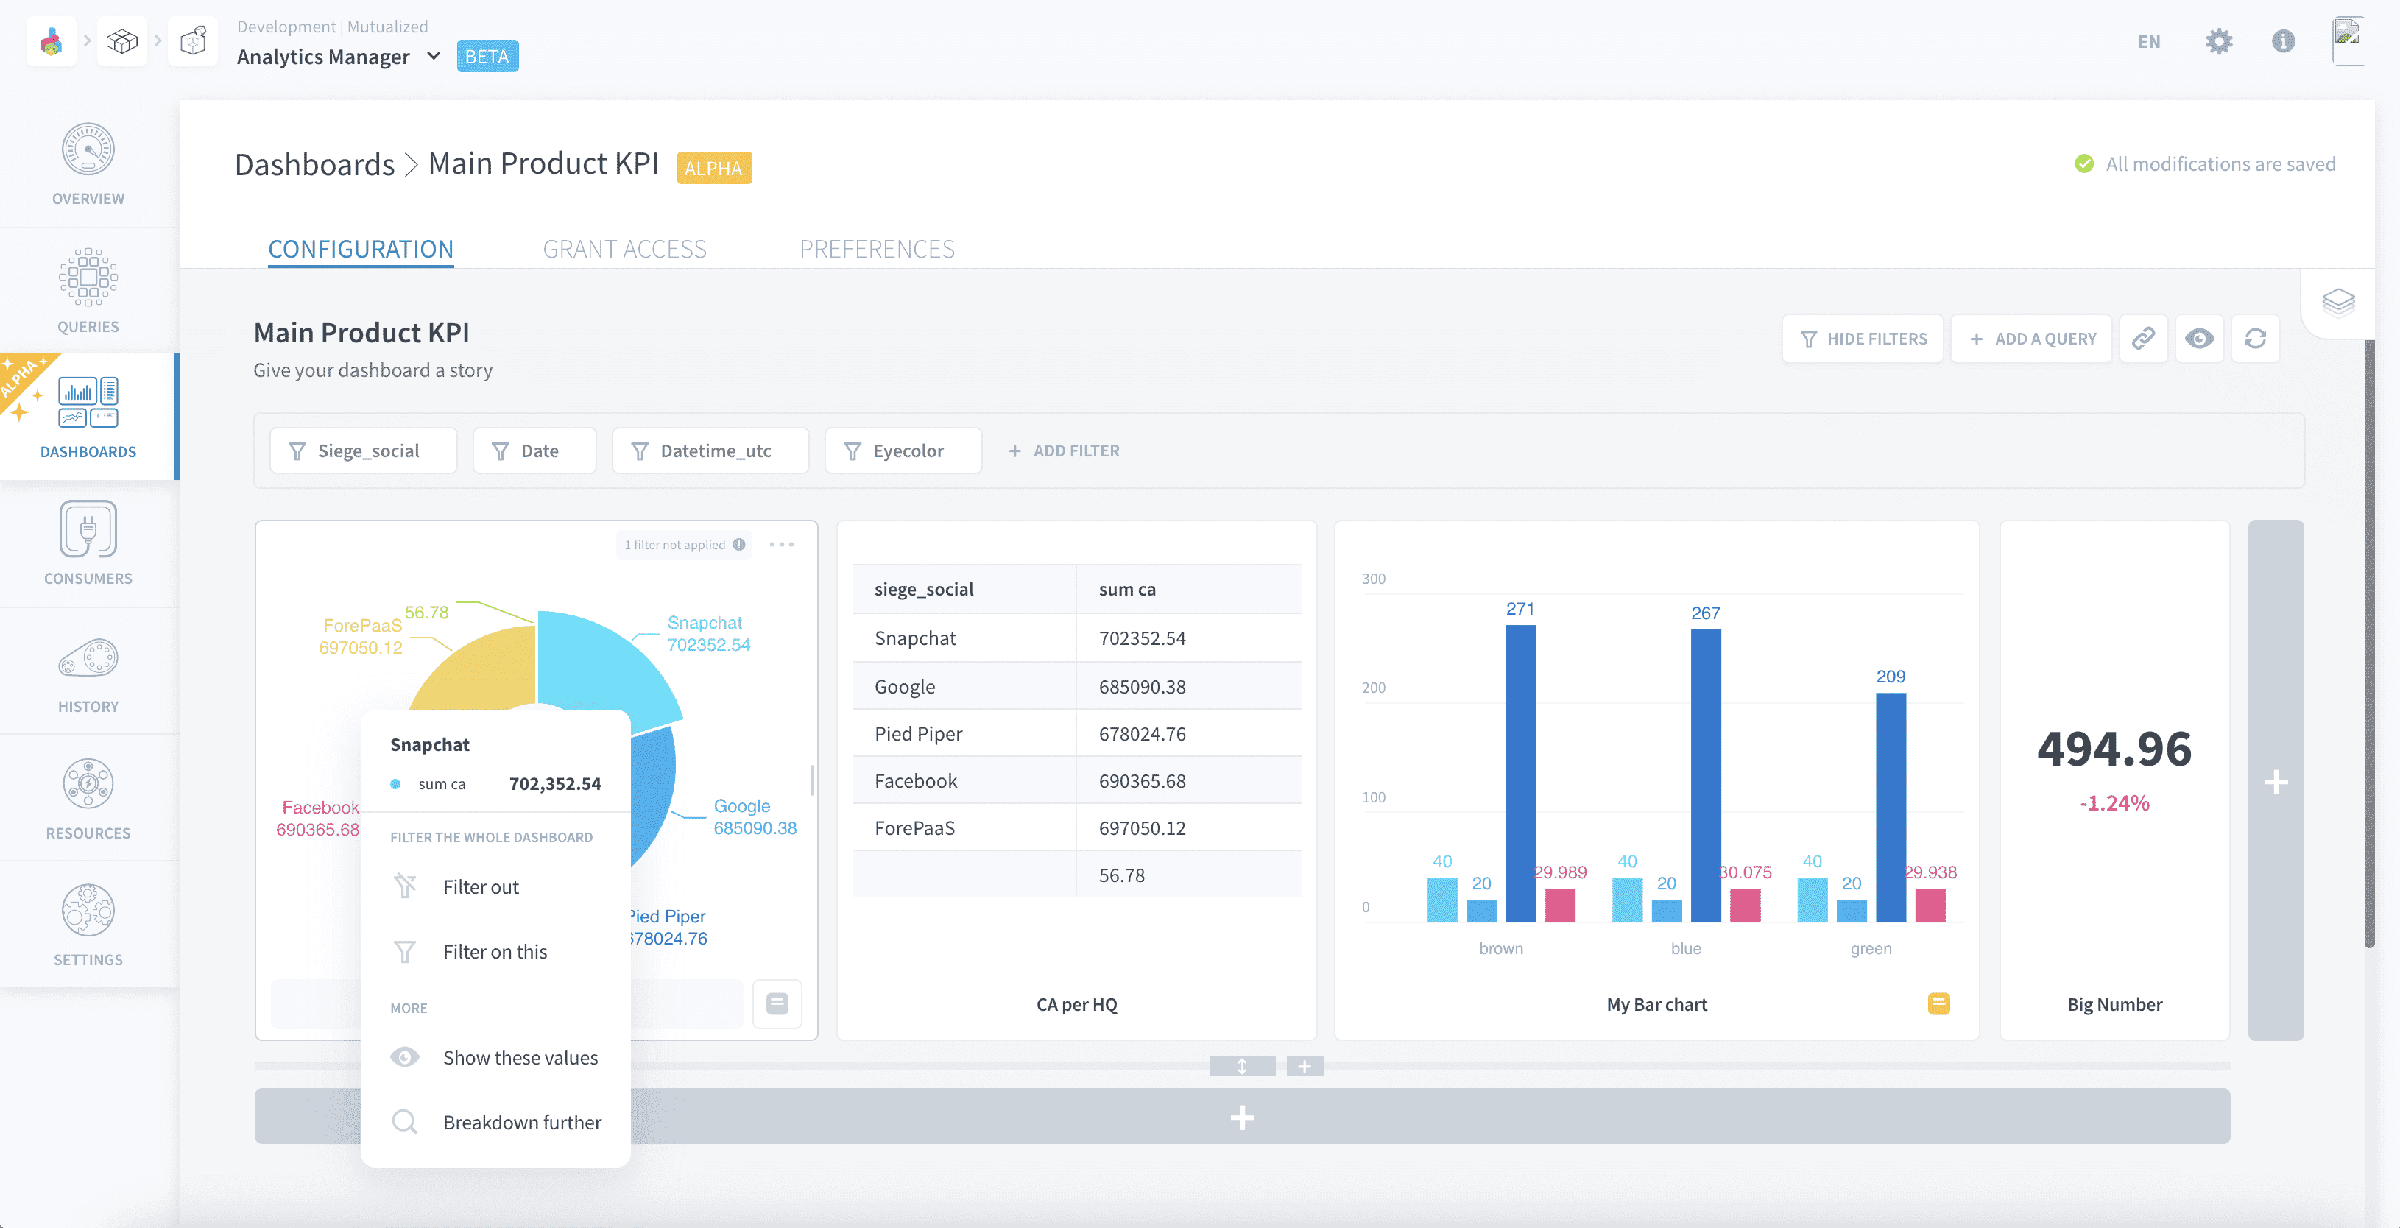
- Filter out: sets a filter on the whole dashboard to exclude the value that was clicked on
- Filter on this: sets a filter on the whole dashboard to show only the value that was clicked on
- Show these values: opens up a new query listing all values (as a SELECT) constituting the part of the graph that was clicked on
- Breakdown further: opens up a new query showing the data point that was clicked on, to let you try out more filters and break down options.
Override visual aspects of the dashboard
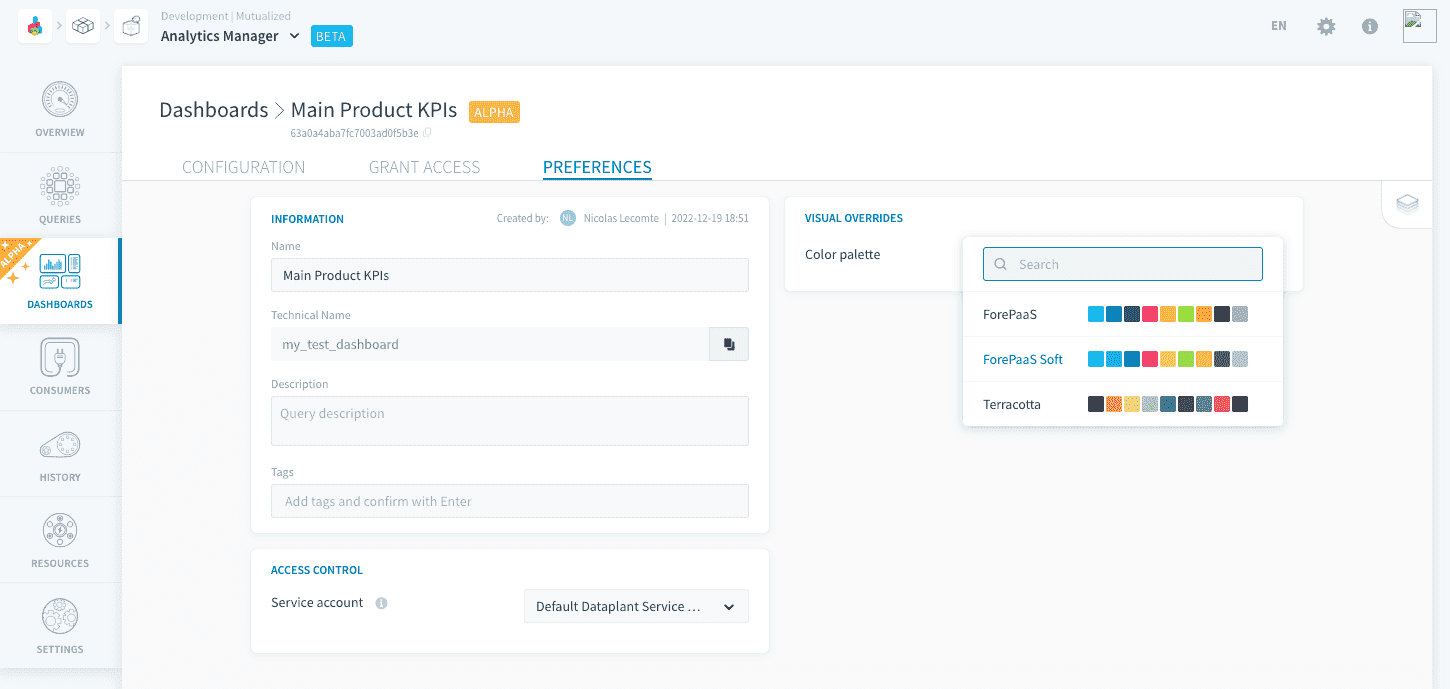
Color palette
The colors of the dashboard are templated in the color palette of the dashboard, in the Preferences page.
Share dashboard
Dashboards are designed to be shared with end-users. In addition to the edition mode, reachable by default from the Dashboards tab, they also all possess a live version, rendered when the dashboard is published.
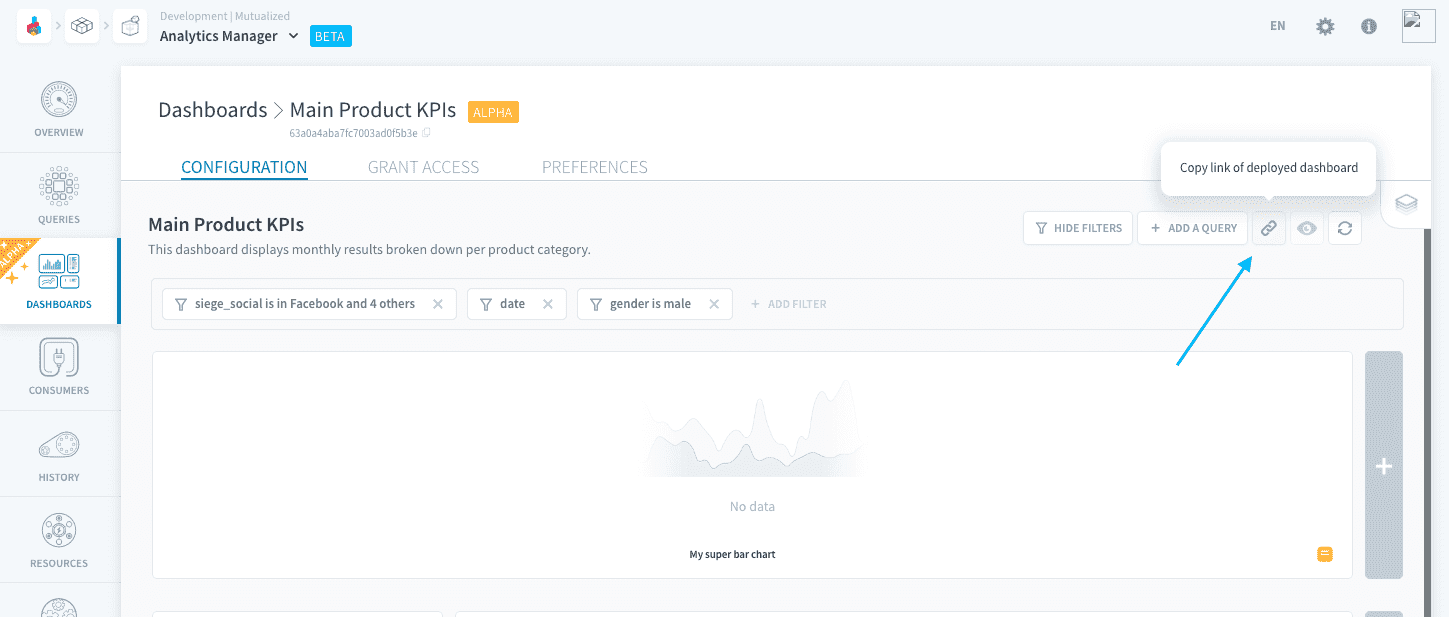
Share a link
Click on the link icon to copy the live dashboard link to the clipboard.
Send a dashboard by email
This feature is coming soon!
Discover how to publish a dashboard
Go further
If you need training or technical assistance to implement our solutions, contact your sales representative or click on this link to get a quote and ask our Professional Services experts for a custom analysis of your project.
Ask questions, give your feedback and interact directly with the team building the Data Platform on the dedicated Discord channel.
If you need support with your OVHcloud services, create a request in our Help Centre.
Join our community of users.