

Switch
Rework pending, no delivery date. The Front App SDK (ReactJS) and the Front API SDK (NodeJS) are both being replaced. This page documents the current release, remains accurate, and is maintained until the replacement ships. Code written against it keeps working.
Switches are used to set conditions on the display of elements (graphics, button, etc.).
If you add multiple items, only the one whose condition is filled first is displayed.
Example:
- Here, only the chart will be displayed :
- 1st case : true - Chart
- 2nd case : true - Button
- Here, only the button will be displayed :
- 1st case : false - Chart
- 2nd case : true - Button
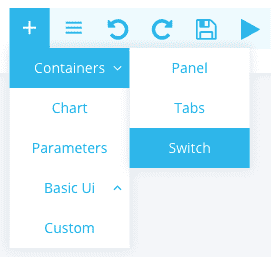
Adding a Switch
Select Container > Tabs.
Configuring a Switch
Simple configuration
This configuration allows you to configure the switch in a simple and intuitive way.

To do this, simply enter the display condition of an element and select the element type.
Then, if you wish, link this switch to a dynamic parameter by selecting it via the drop-down menu. This allows you to use the dynamic parameter data in the conditions.
In the example below, the switch is linked to the siege_social parameter and the Chart element is displayed if "Acme" is selected as the siege_social

You can add as many cases as you want.
Advanced configuration
This configuration allows you to configure the Switch via a JSON document. Below is the JSON corresponding to the Switch created with the simplified configuration: