

Data Platform Extension
Browse the documentation, explore your datasets and buckets, run read-only SQL, open ready-to-use notebooks wired to your own data
Objective
Every Data Platform notebook ships with the Data Platform extension: a companion panel inside JupyterLab that brings the platform to your notebook. Browse the documentation, explore your datasets and buckets, run read-only SQL, open ready-to-use notebooks wired to your own data, and export a notebook as a custom action when it is ready to run as a job. Nothing to install, no credentials to configure: it works the moment your notebook starts.
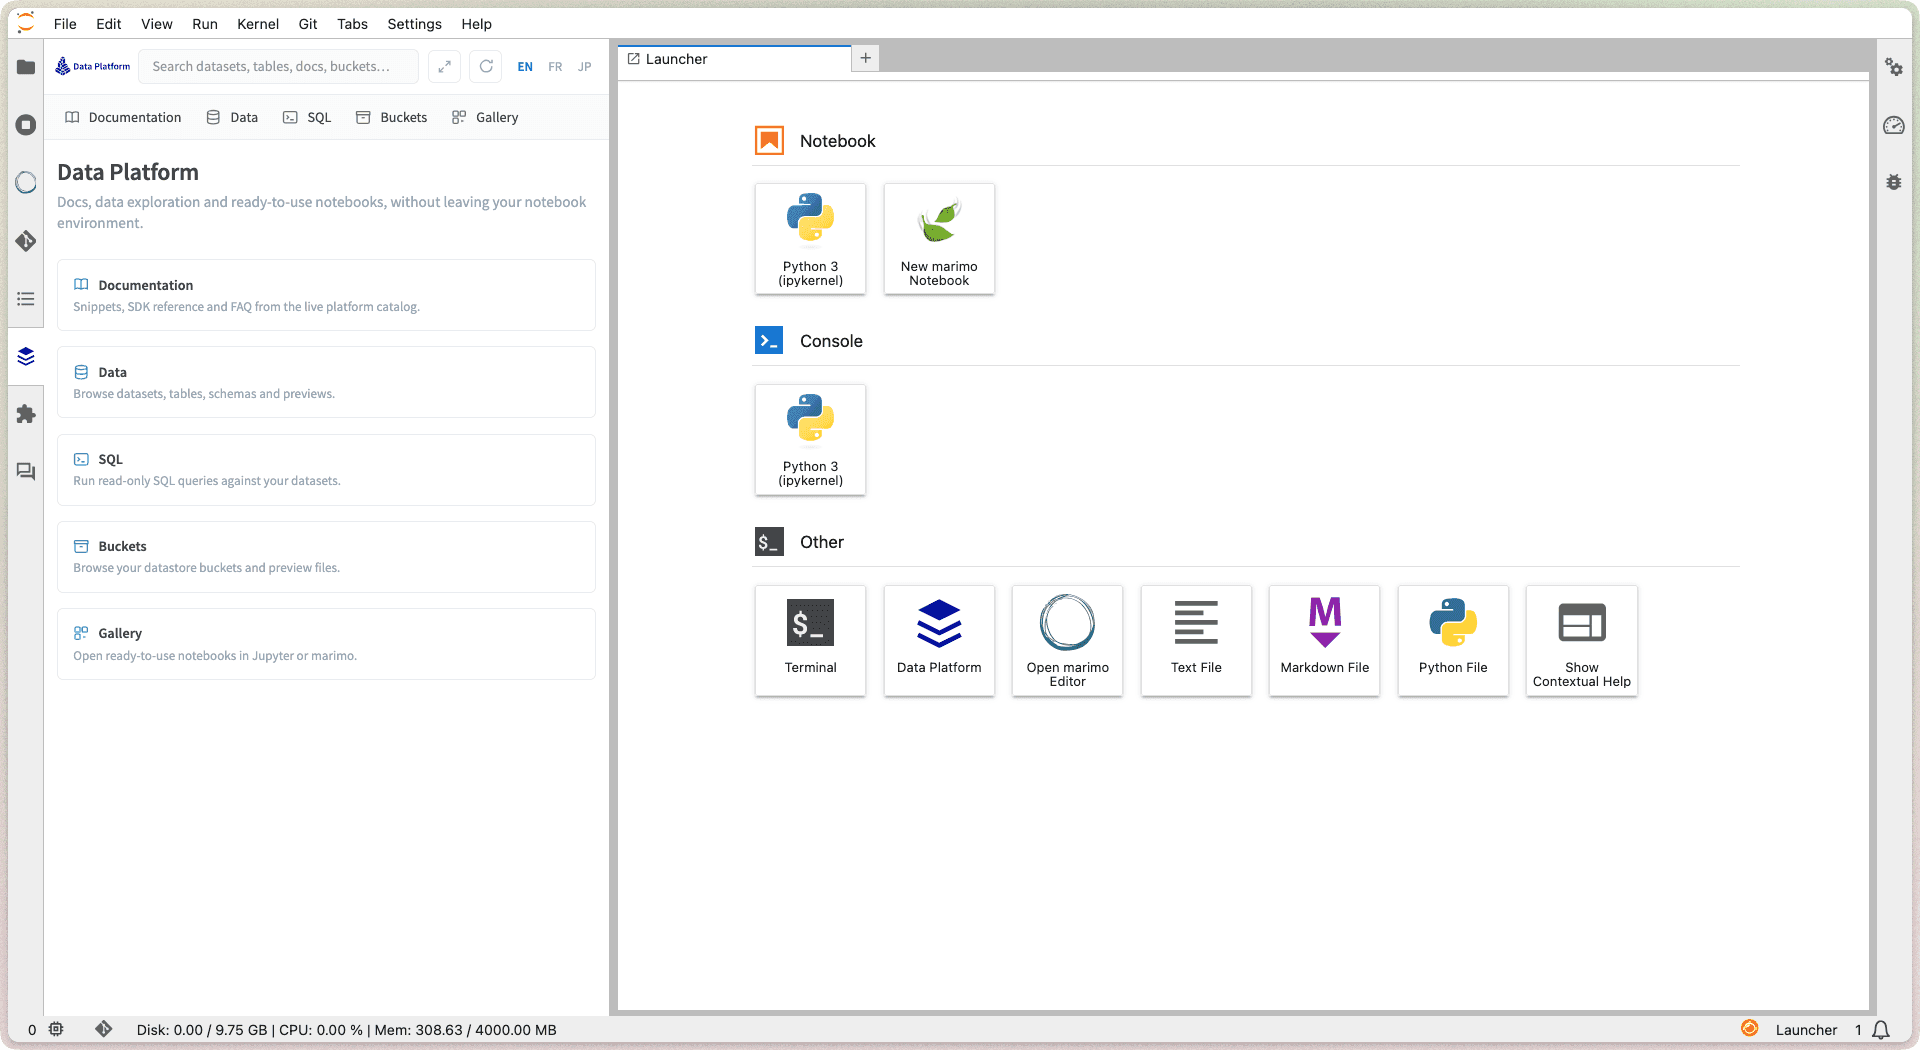
Browsing, previewing and querying are read-only: they never modify your data. The only things the extension creates are the notebooks you generate from the gallery, saved in your home folder, and the custom actions you export.
Open the extension
There are two ways to open it, depending on how you like to work:
- Side panel: click the Data Platform icon in the left sidebar of JupyterLab. The panel opens next to your notebook, so you can explore data and write code side by side. Use the expand button in its top bar to switch to a full-width tab.
- Full view: click the Data Platform tile in the JupyterLab launcher (under Other).
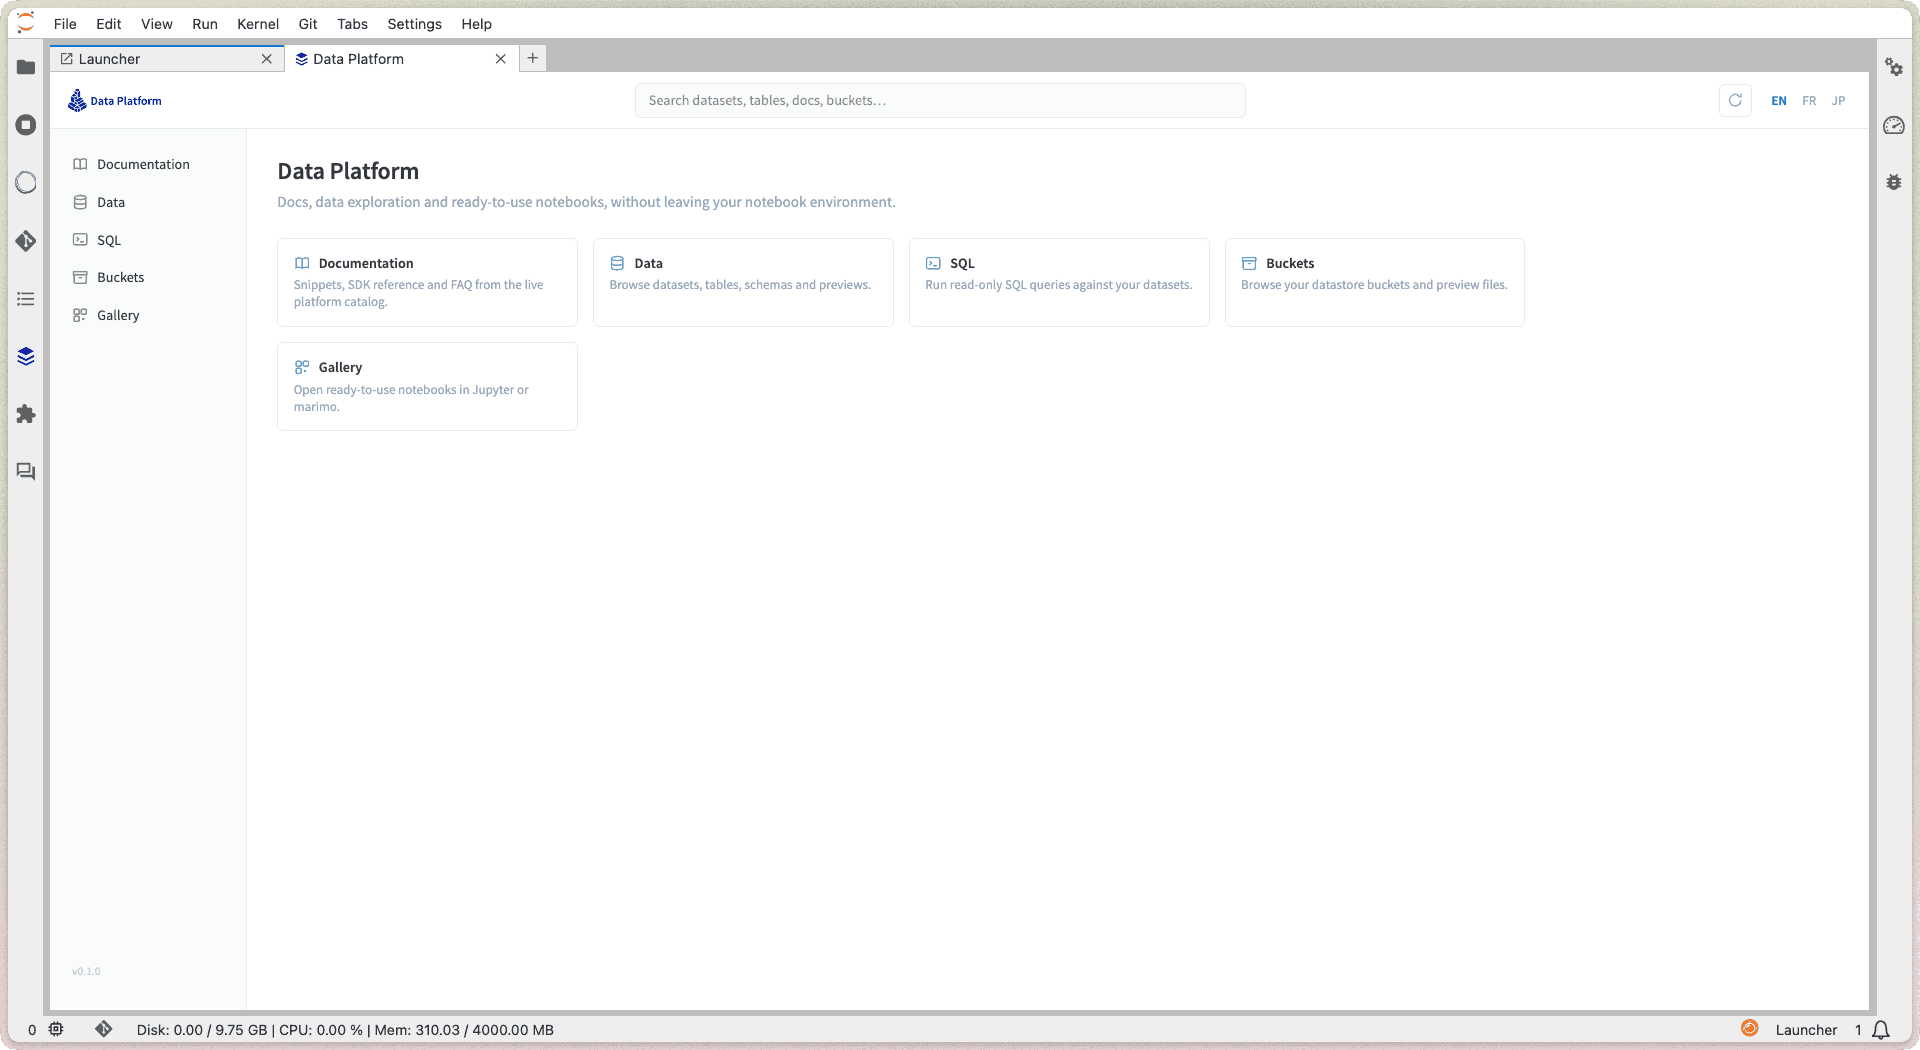
The top bar is always available: a global search field, a refresh button that reloads the platform data (new tables show up immediately), and the language switch.
The extension is available in English, French and Japanese: use the EN / FR / JP switch in the top bar to change the language of the whole panel at any time.
Documentation
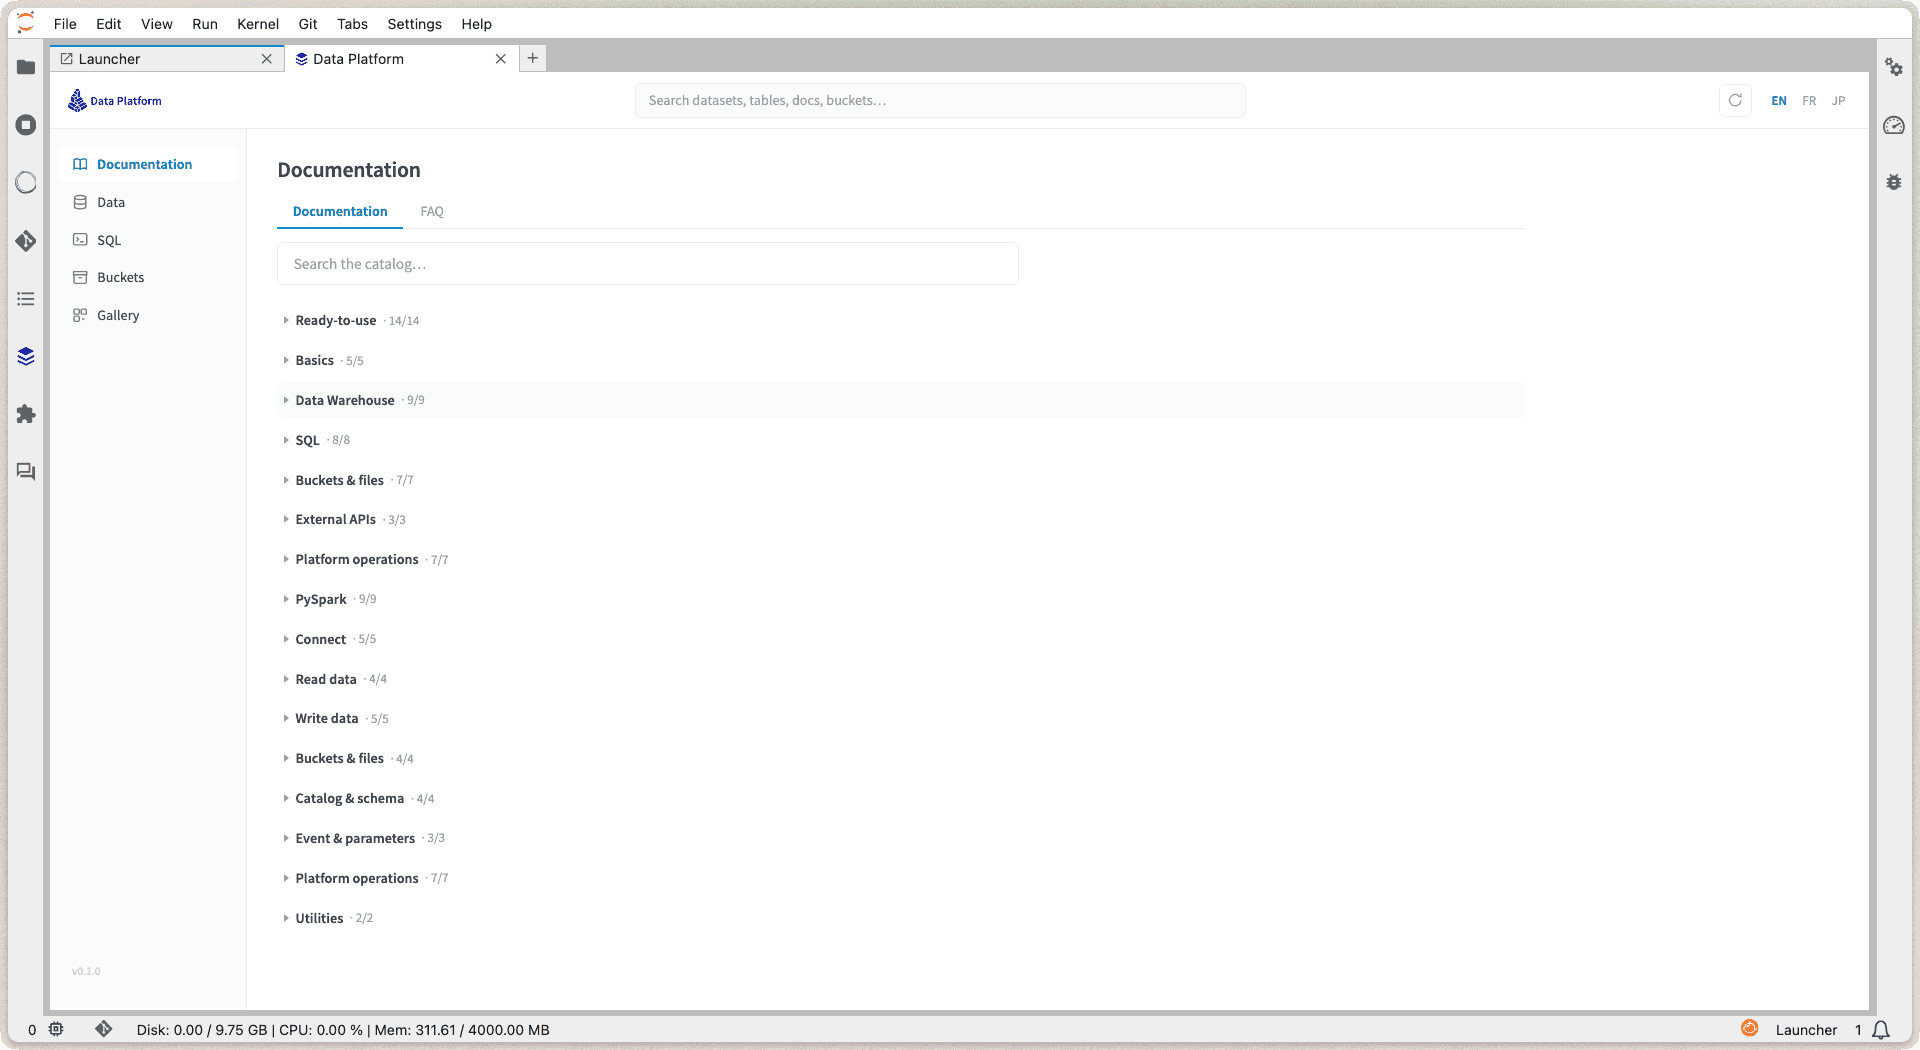
The Documentation tab shows the live platform catalog: complete action scenarios, SDK snippets, a PySpark section and a FAQ. It is the same content that powers the helpers of the platform console, always up to date.
Every snippet has a copy button and a link to the full documentation page. Combined with the table pin (see Data below), the snippets are filled with your real dataset and table names: what you copy runs as-is in your notebook.
Data: browse your datasets
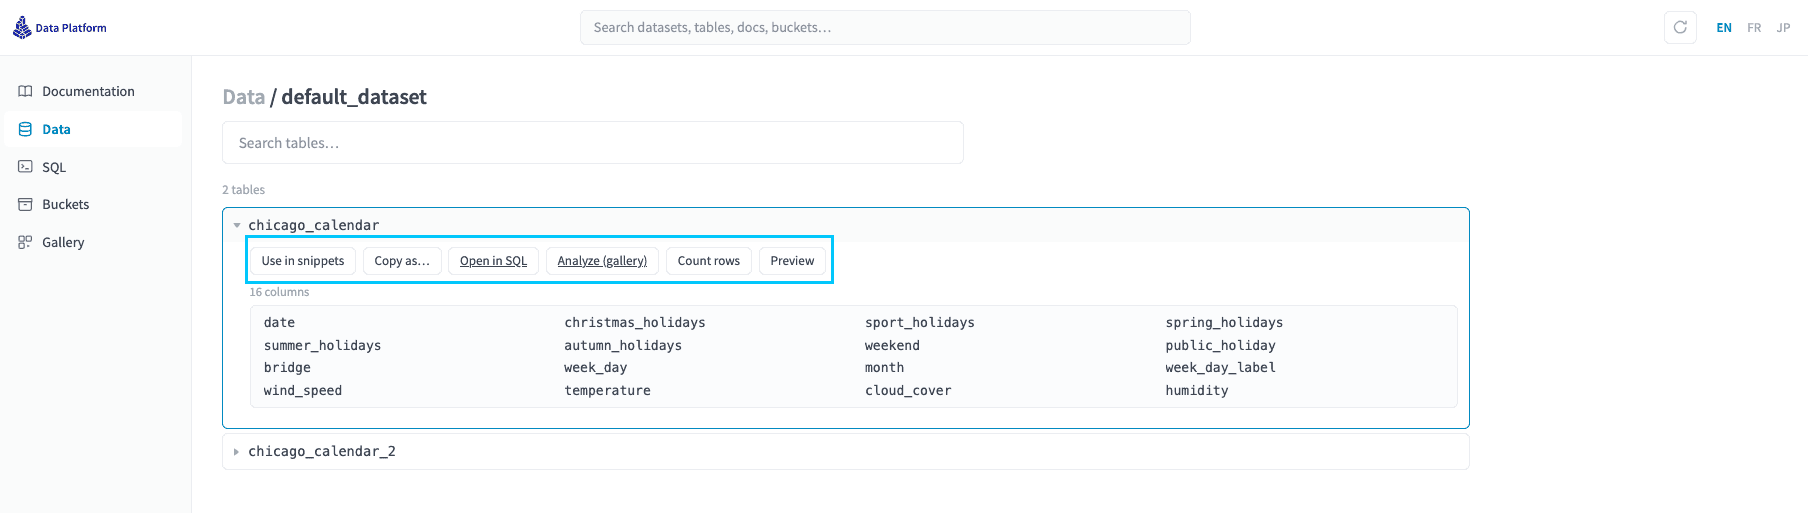
The Data tab lists the datasets of your project, the same ones you see in the Lakehouse Manager. Open a dataset to browse its tables: the search stays instant even with thousands of tables.
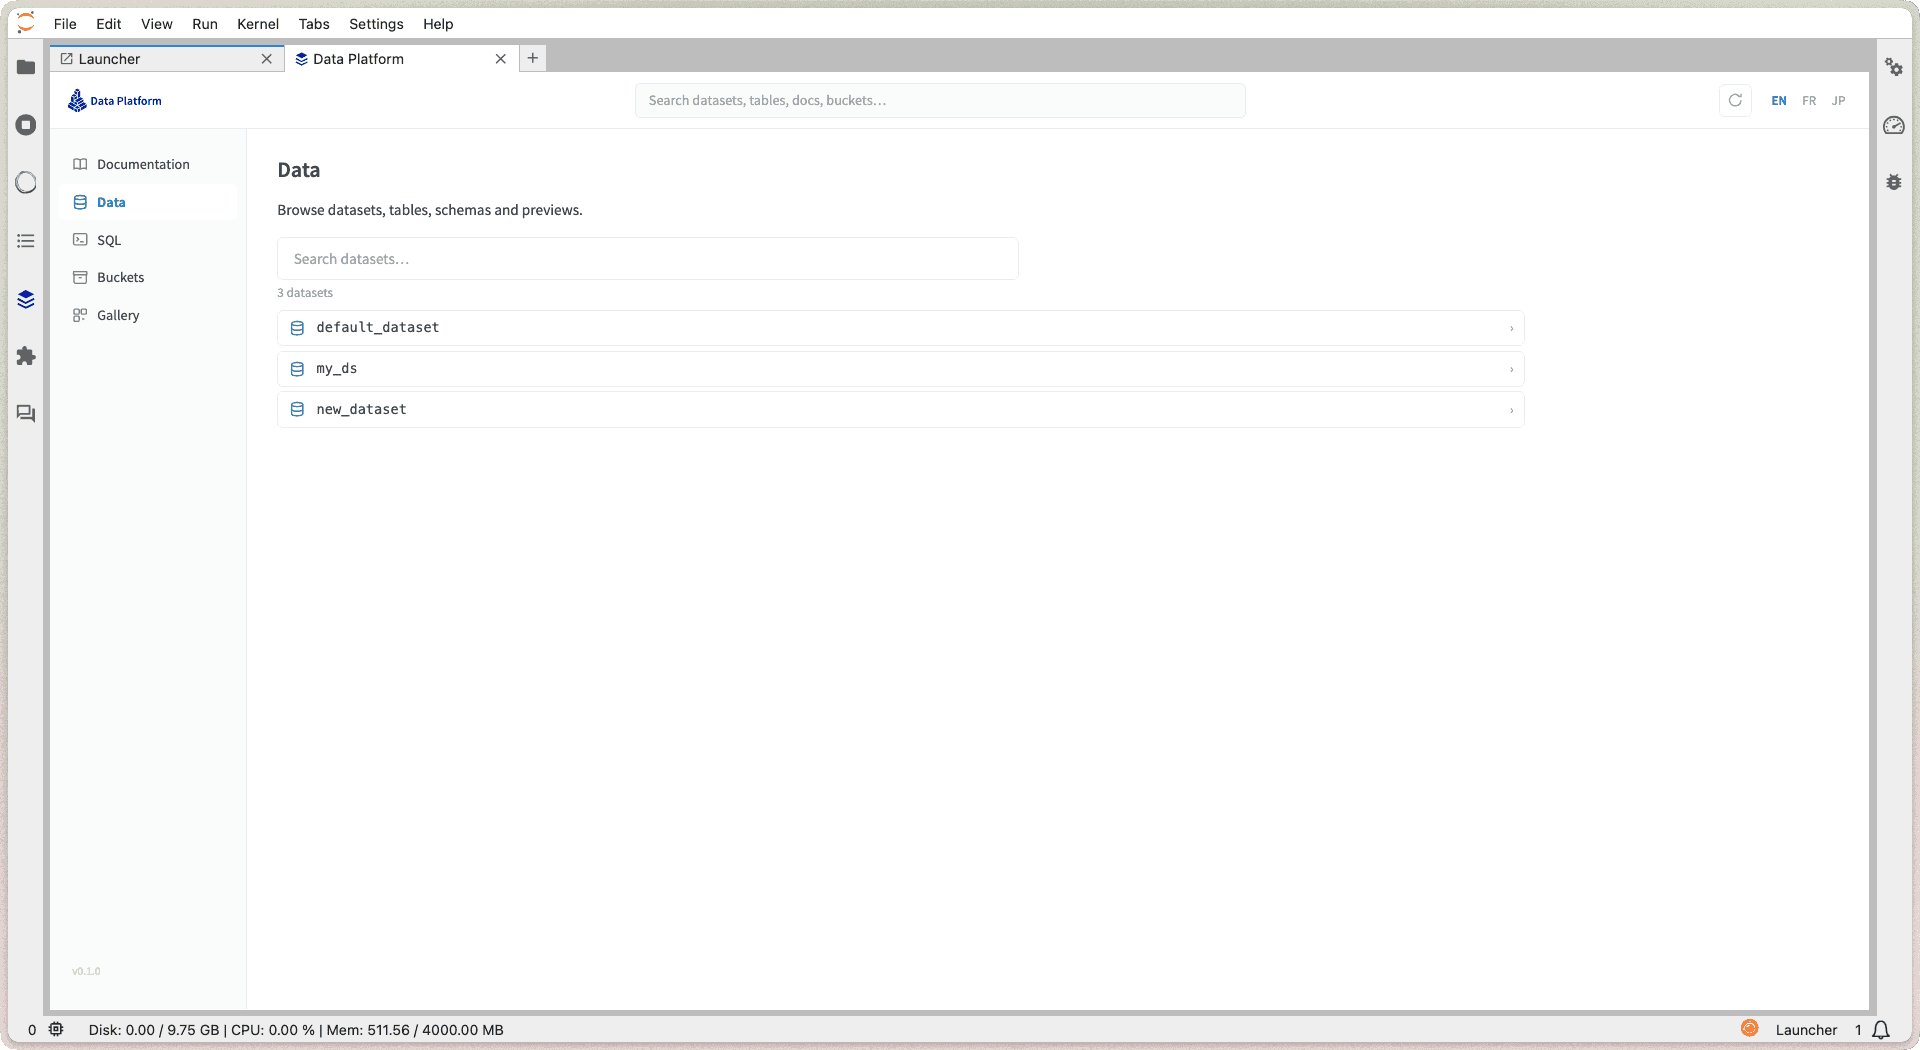
Expand a table to get everything you usually open the console for:
SQL: query without leaving Jupyter
The SQL tab is a lightweight editor to query a dataset in read-only SQL. Pick the dataset, type a SELECT, press Run (or Cmd/Ctrl+Enter): the results show up right below, with the execution time.
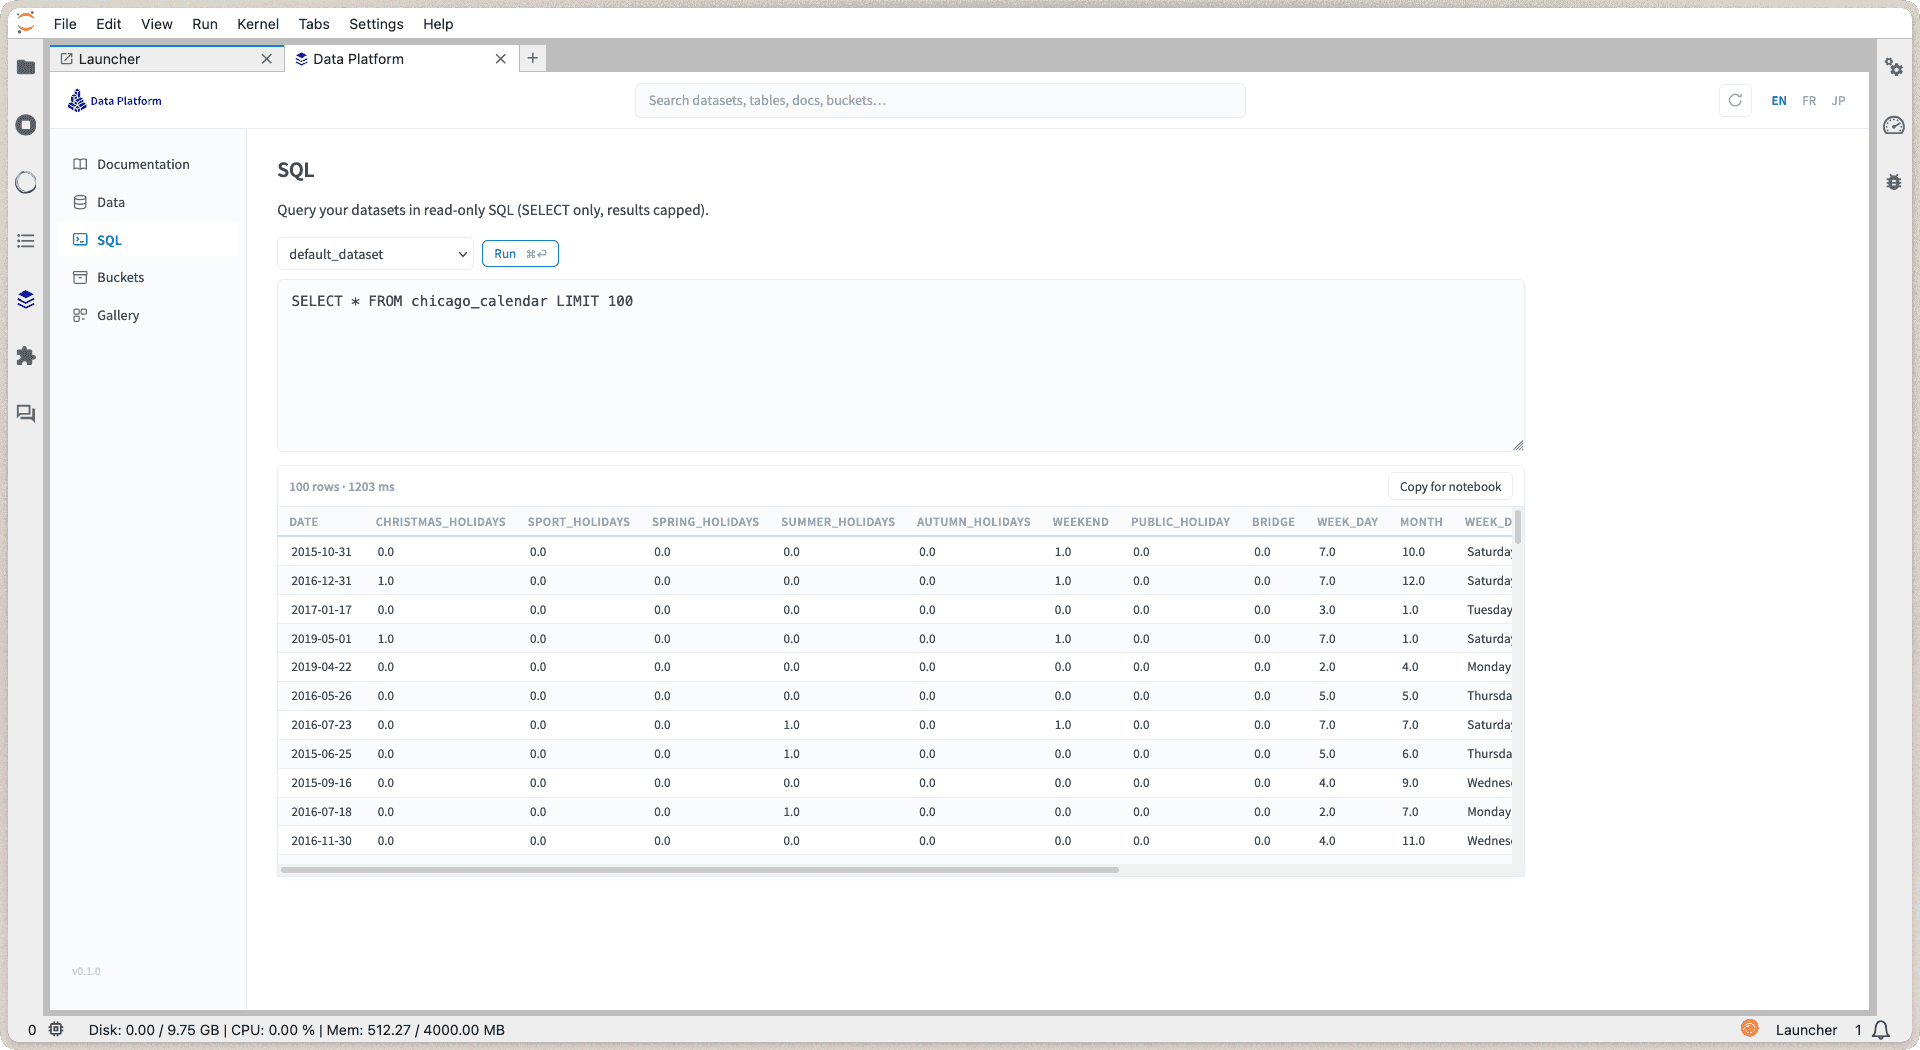
A few guardrails keep it safe and fast:
- only SELECT queries are accepted: nothing can be modified from here;
- a row limit is added automatically if you forget one;
- Copy for notebook on any result gives you the exact SDK code to reproduce the query in a notebook cell.
Buckets: explore your files
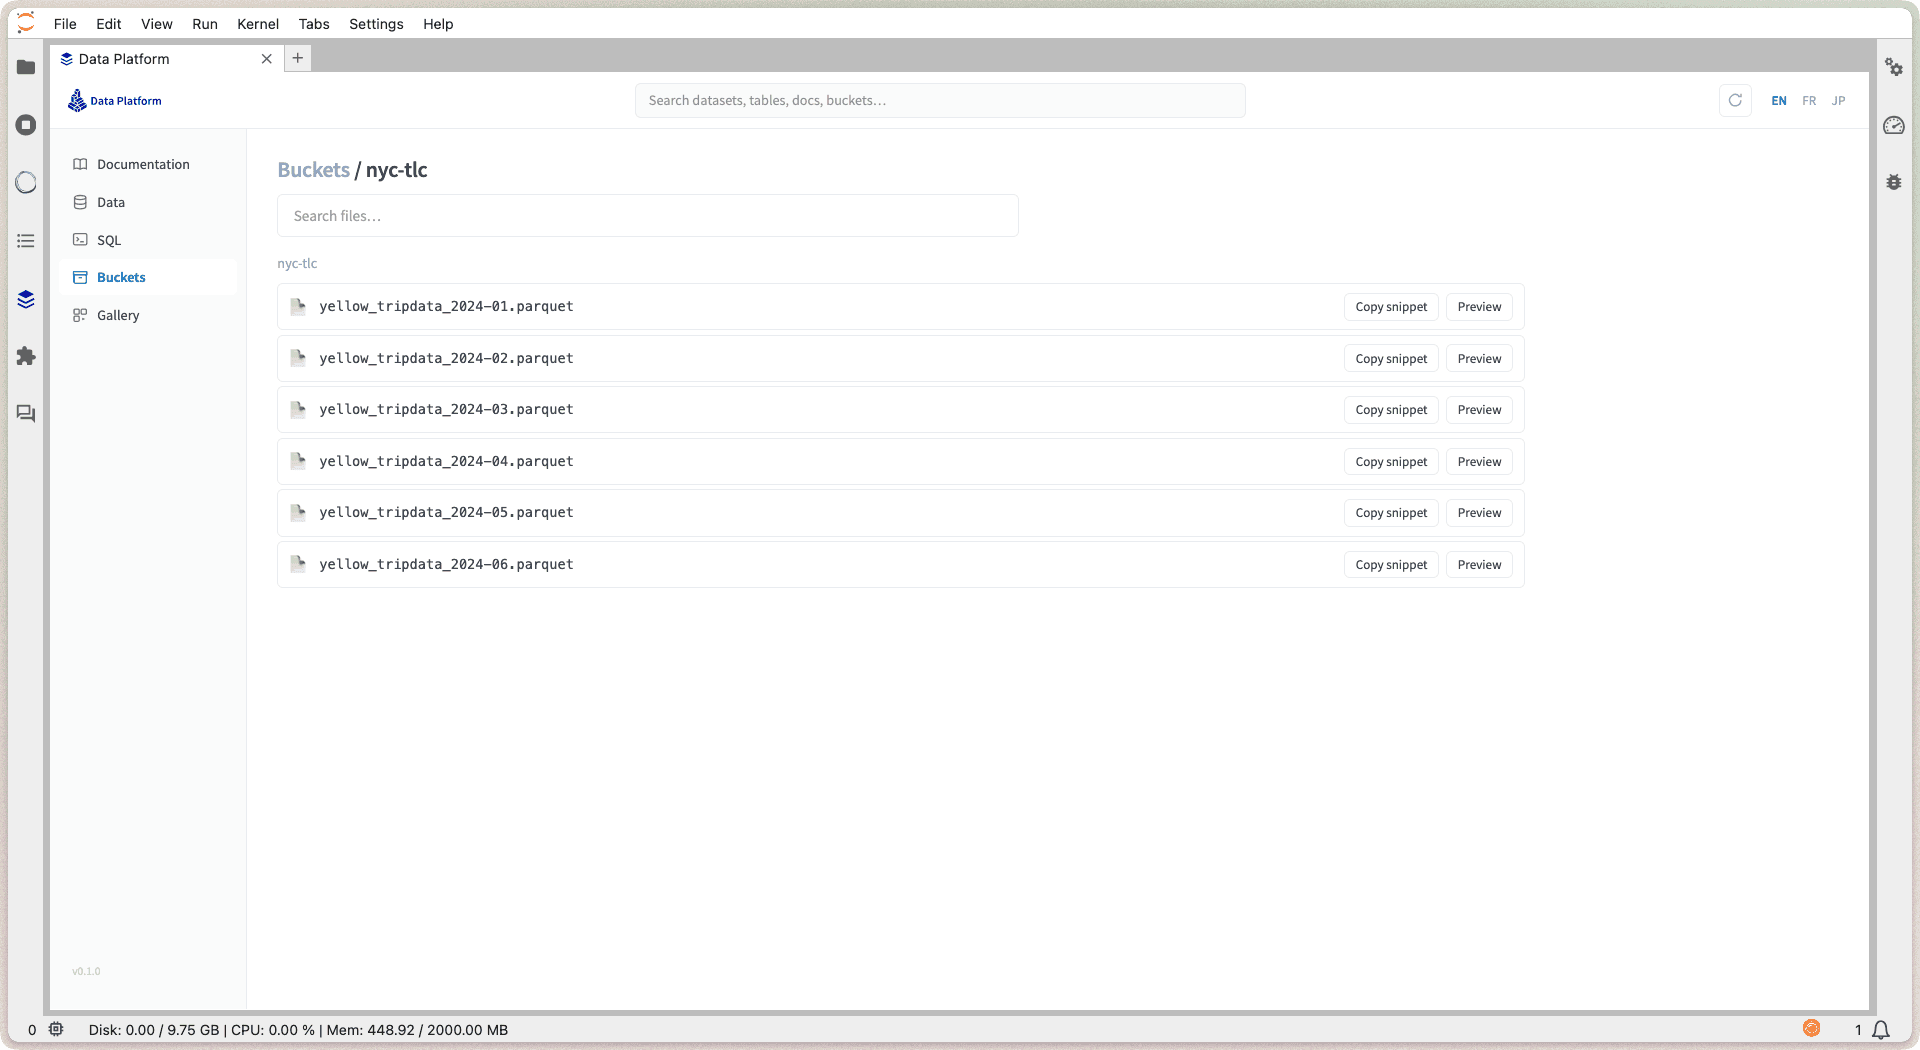
The Buckets tab is a file explorer over the buckets of your project: navigate folders, see file sizes. Every file comes with a copy-ready snippet to read it from your notebook.
Notebook gallery
The Gallery is a set of ready-to-use notebooks, organized in packs. When you click Create & open, a pop-up lets you choose:
- wire it to a real table of your project: the notebook opens already connected to your data, ready to run top to bottom;
- keep the placeholders: you get a generic template to adapt later.
The notebook is created in your home folder and opens immediately as a JupyterLab tab.
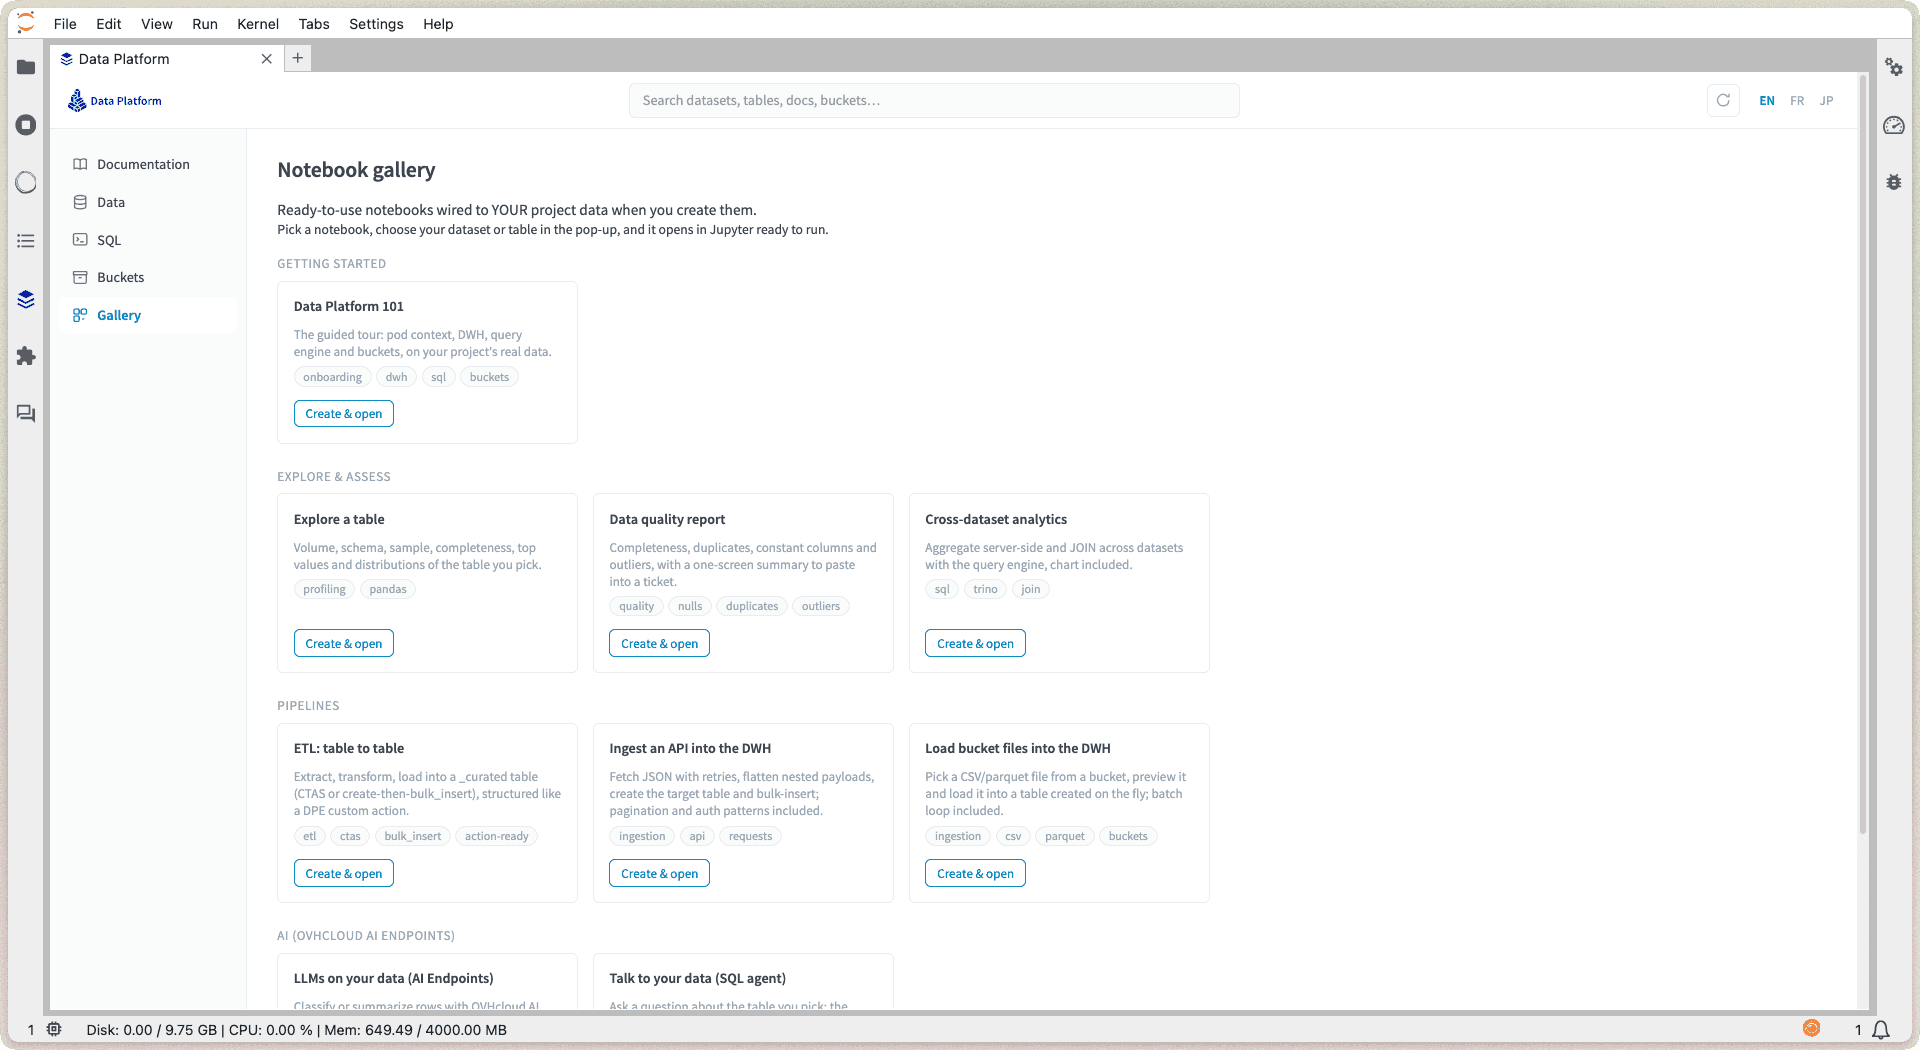
The gallery adapts to your notebook image: the ML notebooks appear on Data Science and TensorFlow notebooks, and the PySpark starter on PySpark notebooks.
The AI pack uses OVHcloud AI Endpoints with your own API key. The rows you select are sent to the AI Endpoints API, so mind data sensitivity. See also Jupyter AI Extension for the chat assistant.
Export a notebook as a custom action
Once your notebook code is ready to run as a job, the extension can turn it into a Custom action without leaving JupyterLab, and without copying code around.
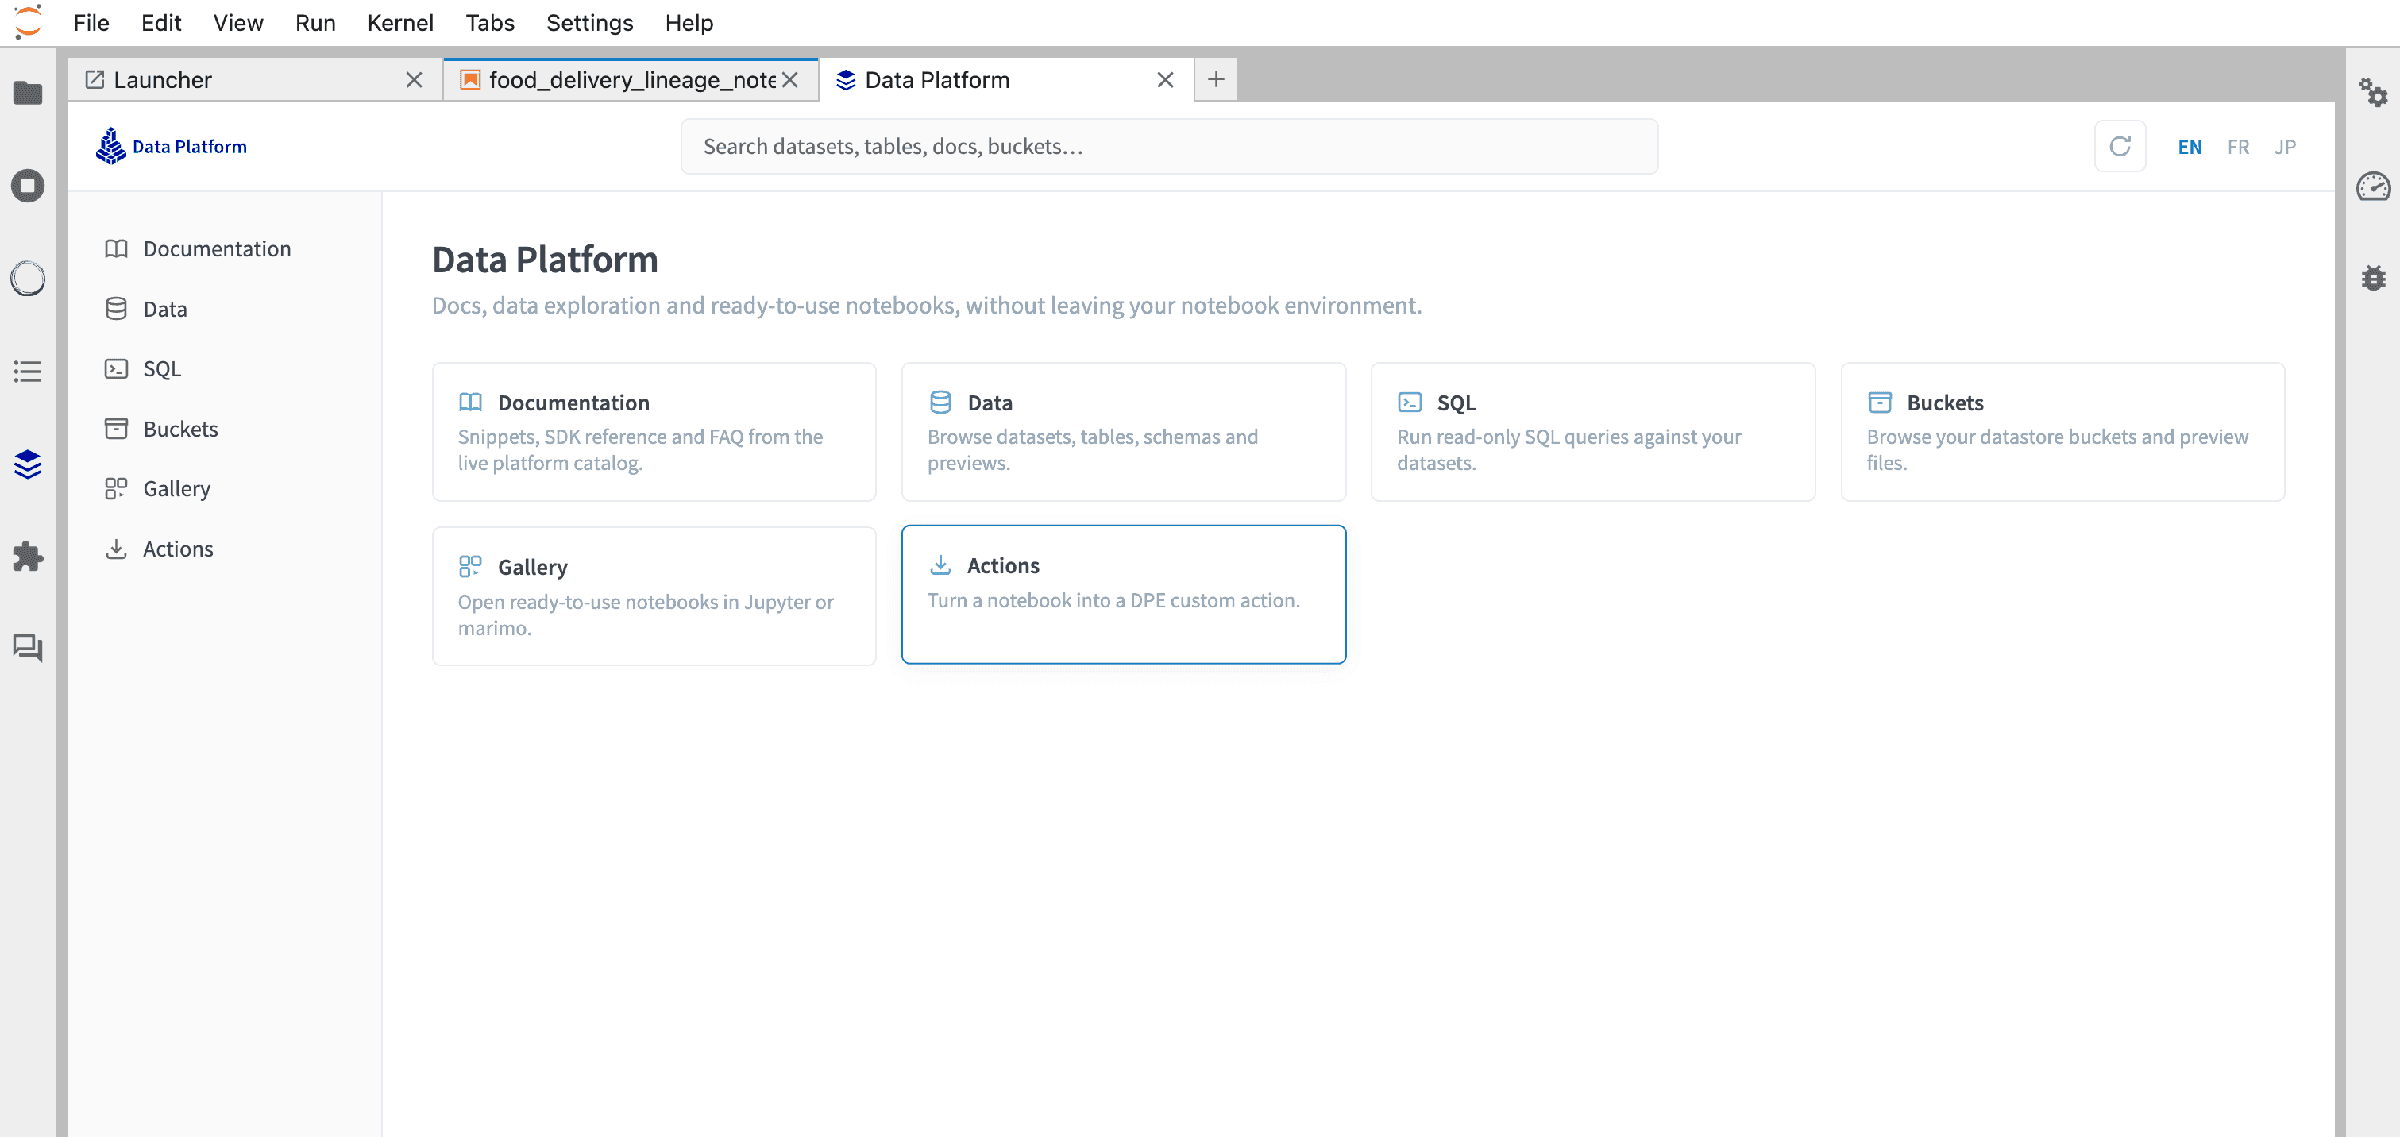
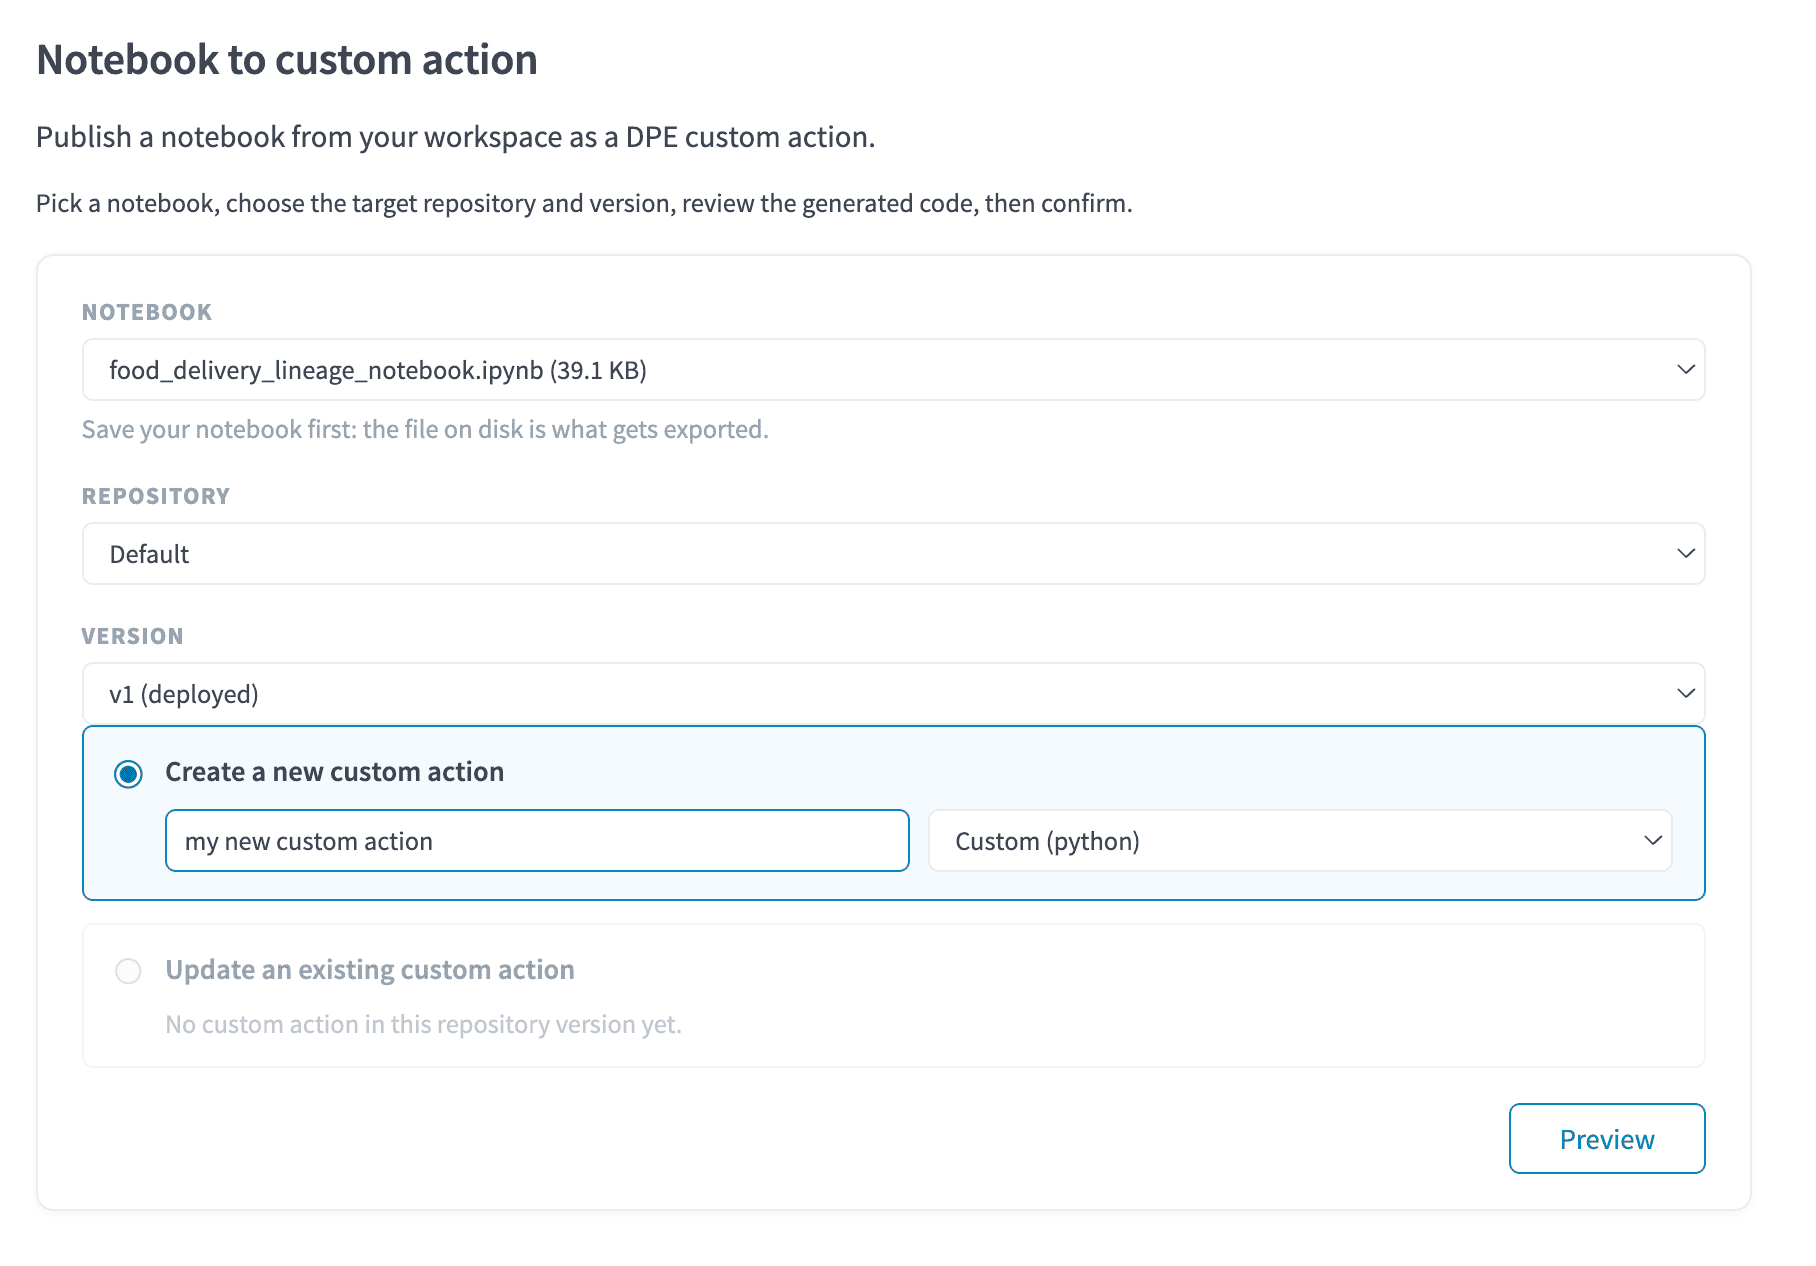
Start the export from the extension, then fill in the export form:
- Select the notebook to export.
- Pick the repository of the Data Processing Engine the action is exported to.
- Choose whether to create a new custom action or replace an existing action with this export.
- Give the action a name, and pick its type: Custom Python or Custom PySpark.
- Click Preview.
The preview sums up what will be created: target repository and version, action name and type, entry function, code size, and the dependencies detected from the notebook's pip installs, automatically converted into action dependencies. Below the summary you can review the generated code: non-code cells are dropped, and the code is wrapped in a def customfunc(event): entry function to match the action format.
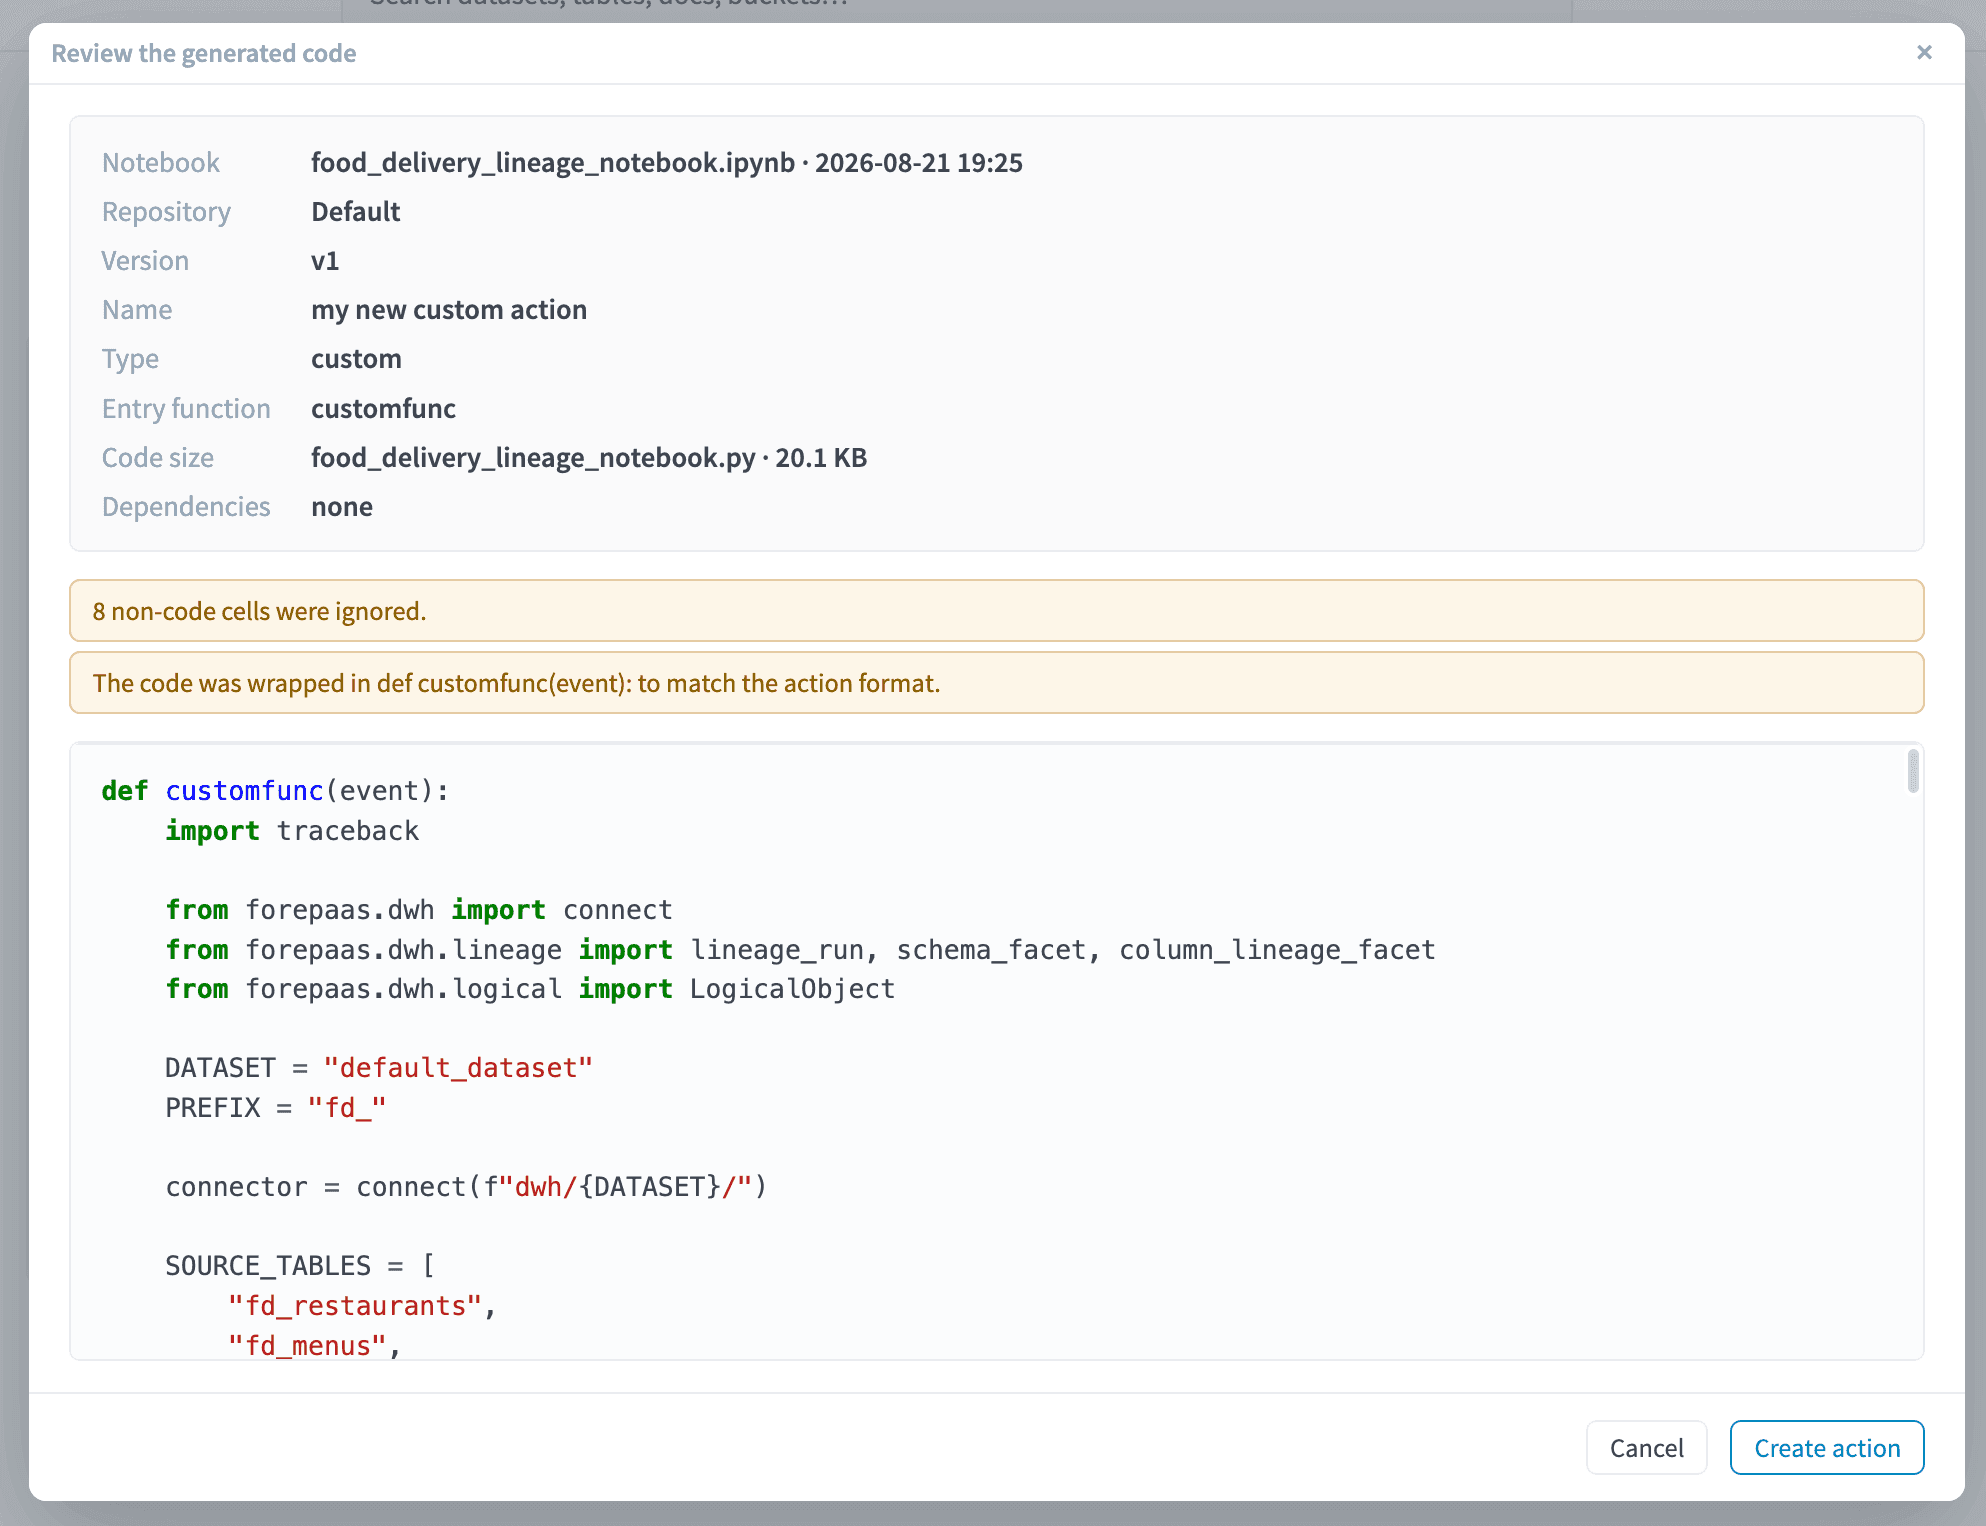
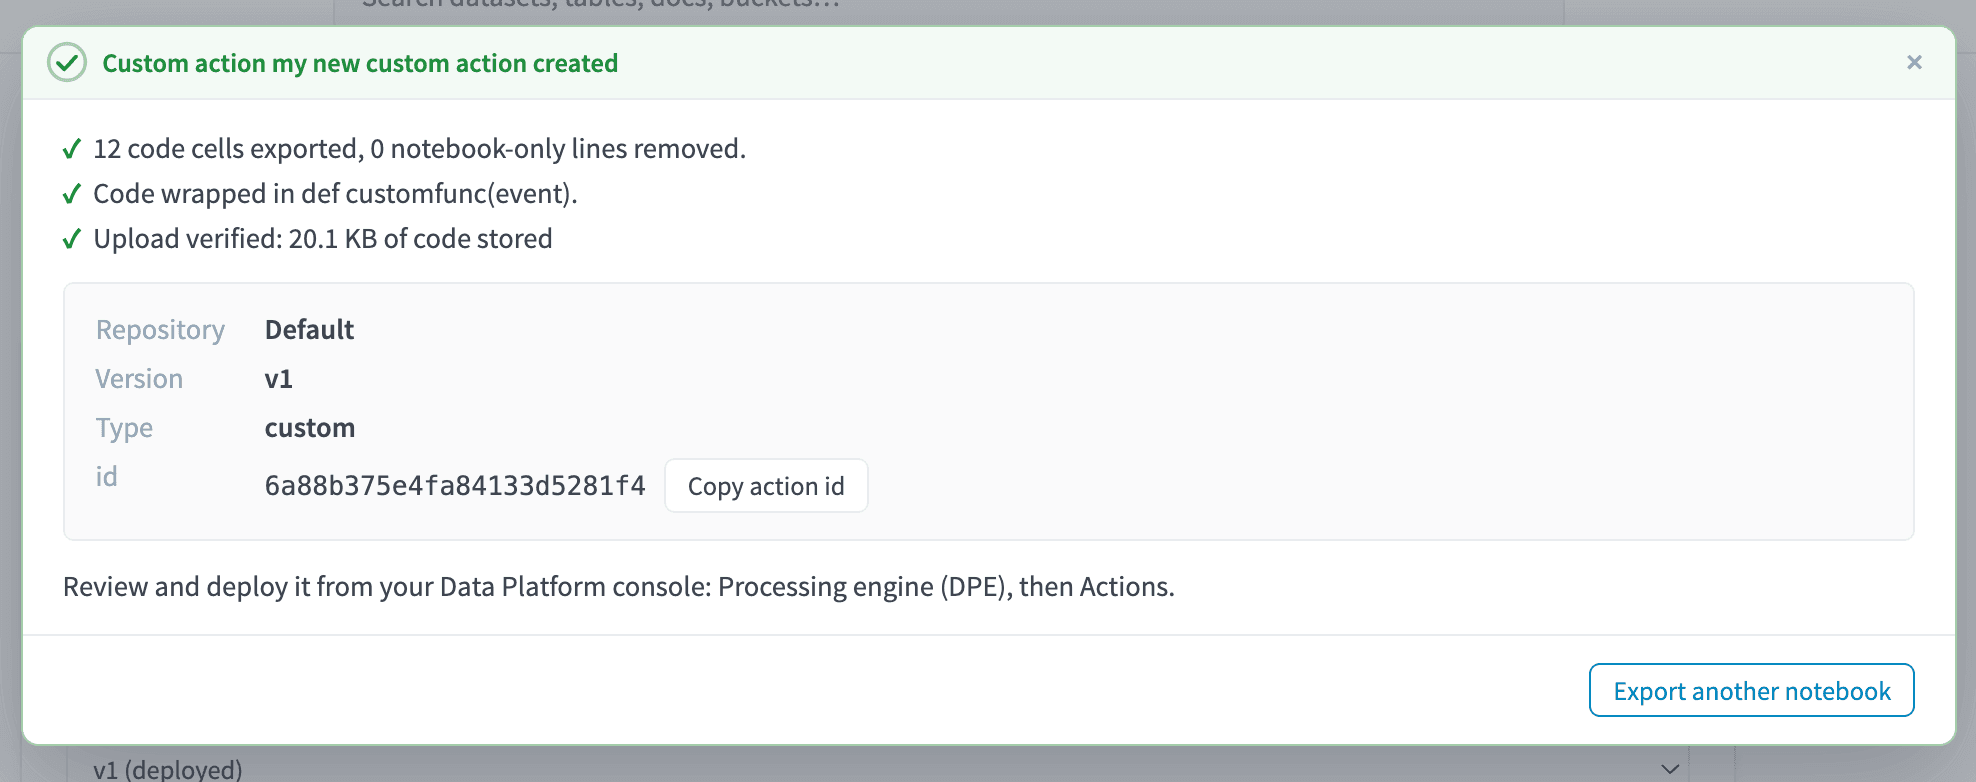
Happy with the result? Click Create action. The action is then available in the Actions screen like any other custom action: configure it, run it, or schedule it in a workflow.
Search everything
The search bar at the top looks across the whole extension at once: documentation snippets, datasets, tables you have browsed, and buckets. Results are grouped by type; clicking a table opens it directly with its details expanded.

Go further
If you need training or technical assistance to implement our solutions, contact your sales representative or click on this link to get a quote and ask our Professional Services experts for a custom analysis of your project.
Ask questions, give your feedback and interact directly with the team building the Data Platform on the dedicated Discord channel.
If you need support with your OVHcloud services, create a request in our Help Centre.
Join our community of users.