

Enhance Your Data Analysis with AI Endpoints on the Data Platform
No more worries about imperfect datasets: import, clean, and visualize your data with the Data Platform
Objective
No more worries about imperfect datasets: import, clean, and visualize your data with the Data Platform. But that's not all! Benefit from detailed analysis thanks to AI and go even further by asking your LLM to find a Machine Learning rule that fits perfectly with your data.
This guide will demonstrate how to take advantage of AI Endpoints to enhance your data analysis capabilities on the Data Platform. You'll learn how to start from scratch and generate meaningful predictions from your data.
Here you can find all the resources used (CSV files, Python scripts, etc.) for the purpose of this guide. Please download all required files before you begin:
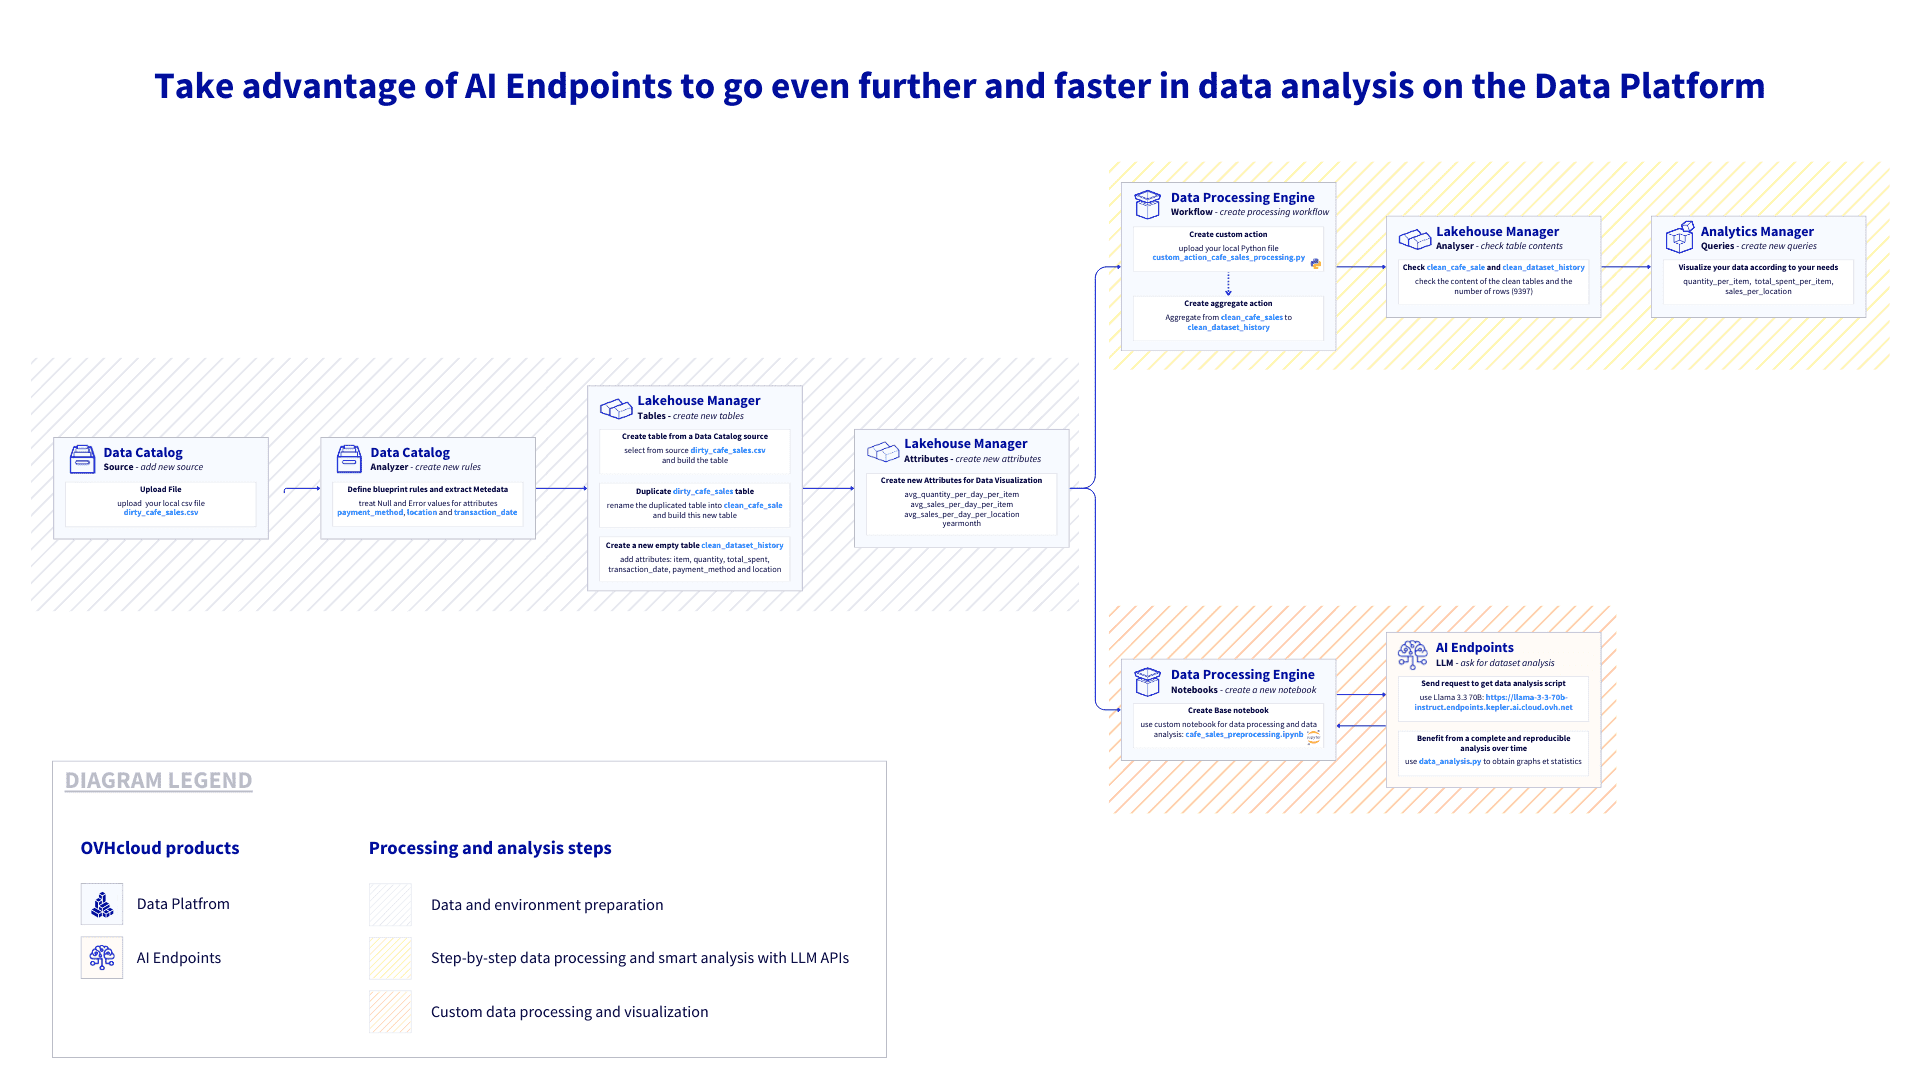
Tutorial Steps
step 1 - Upload CSV file
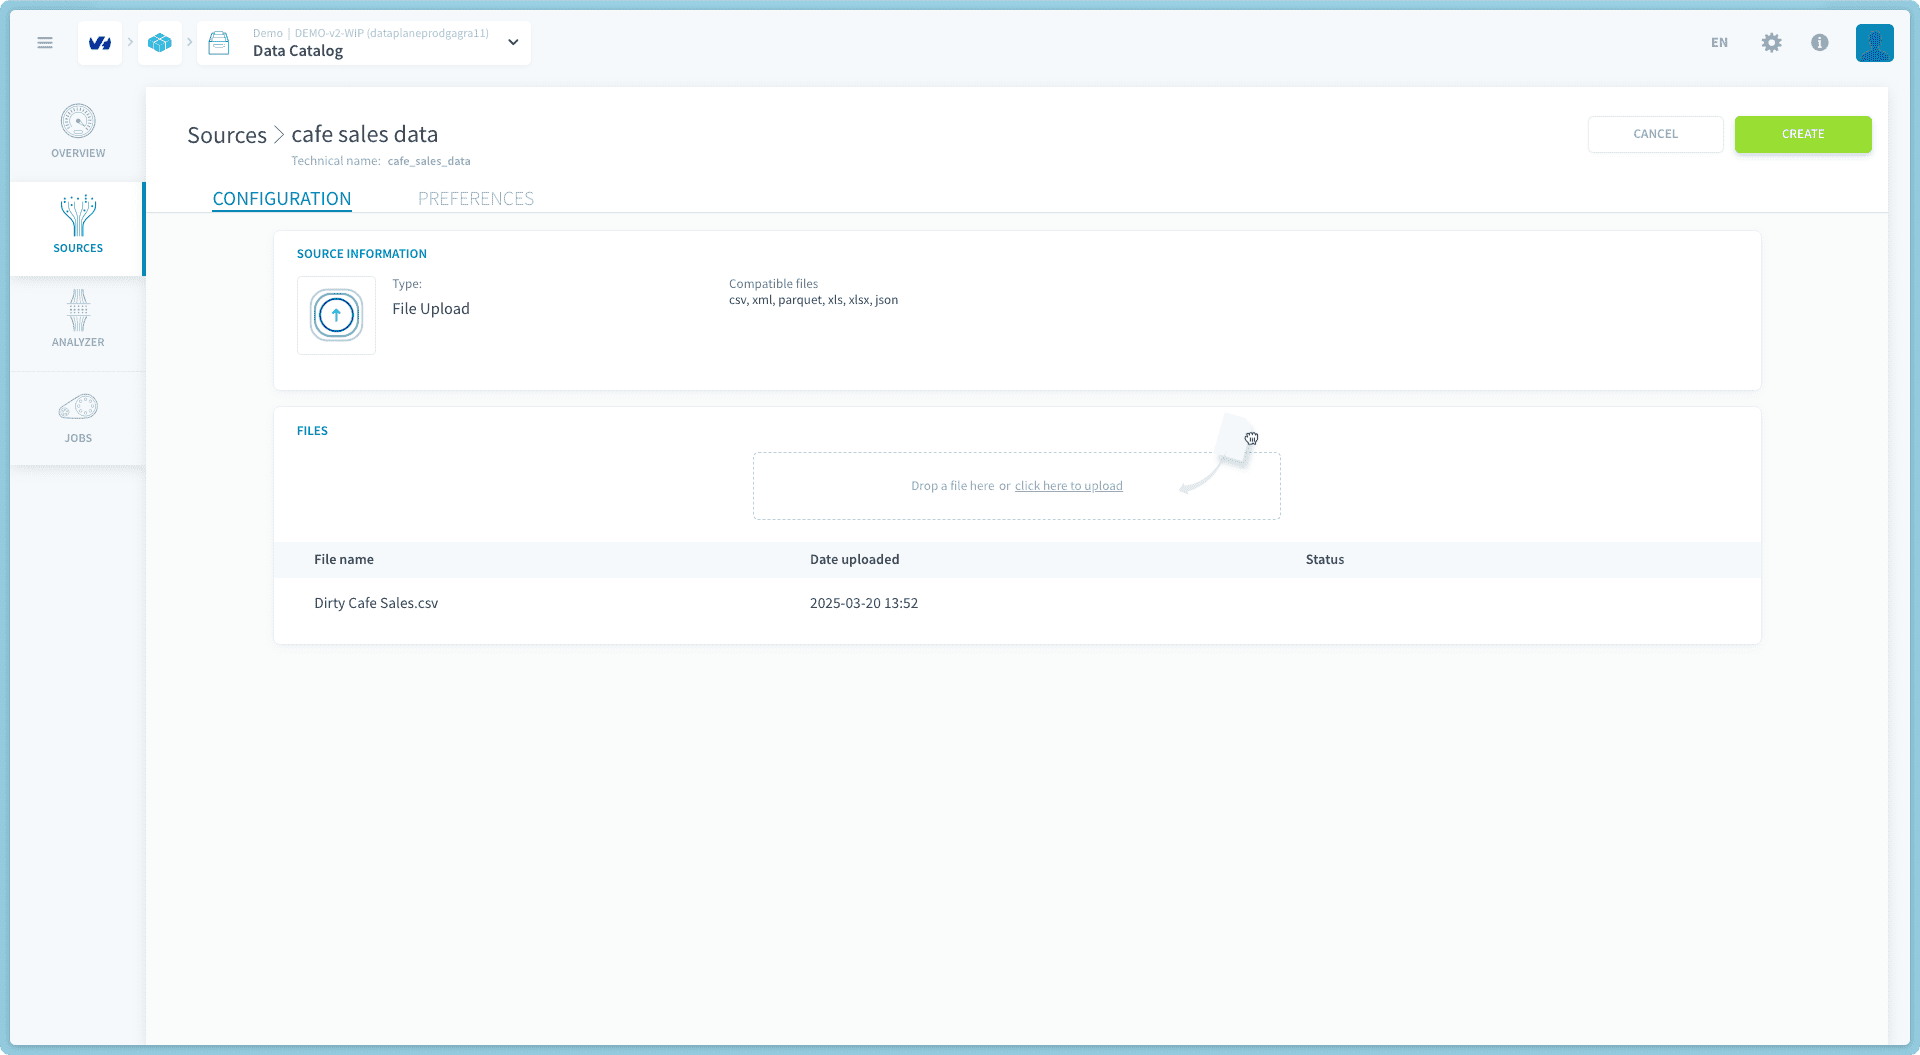
The first step is to access the Connectors, create a new source, and choose File Upload to upload the CSV file. For the purpose of this guide we will be using the - Dirty Cafe Sales Dataset
step 2 - Analyze the source and define blueprint rules
Access the Analyser from the Connectors and click on the newly added source to extract the metadata.
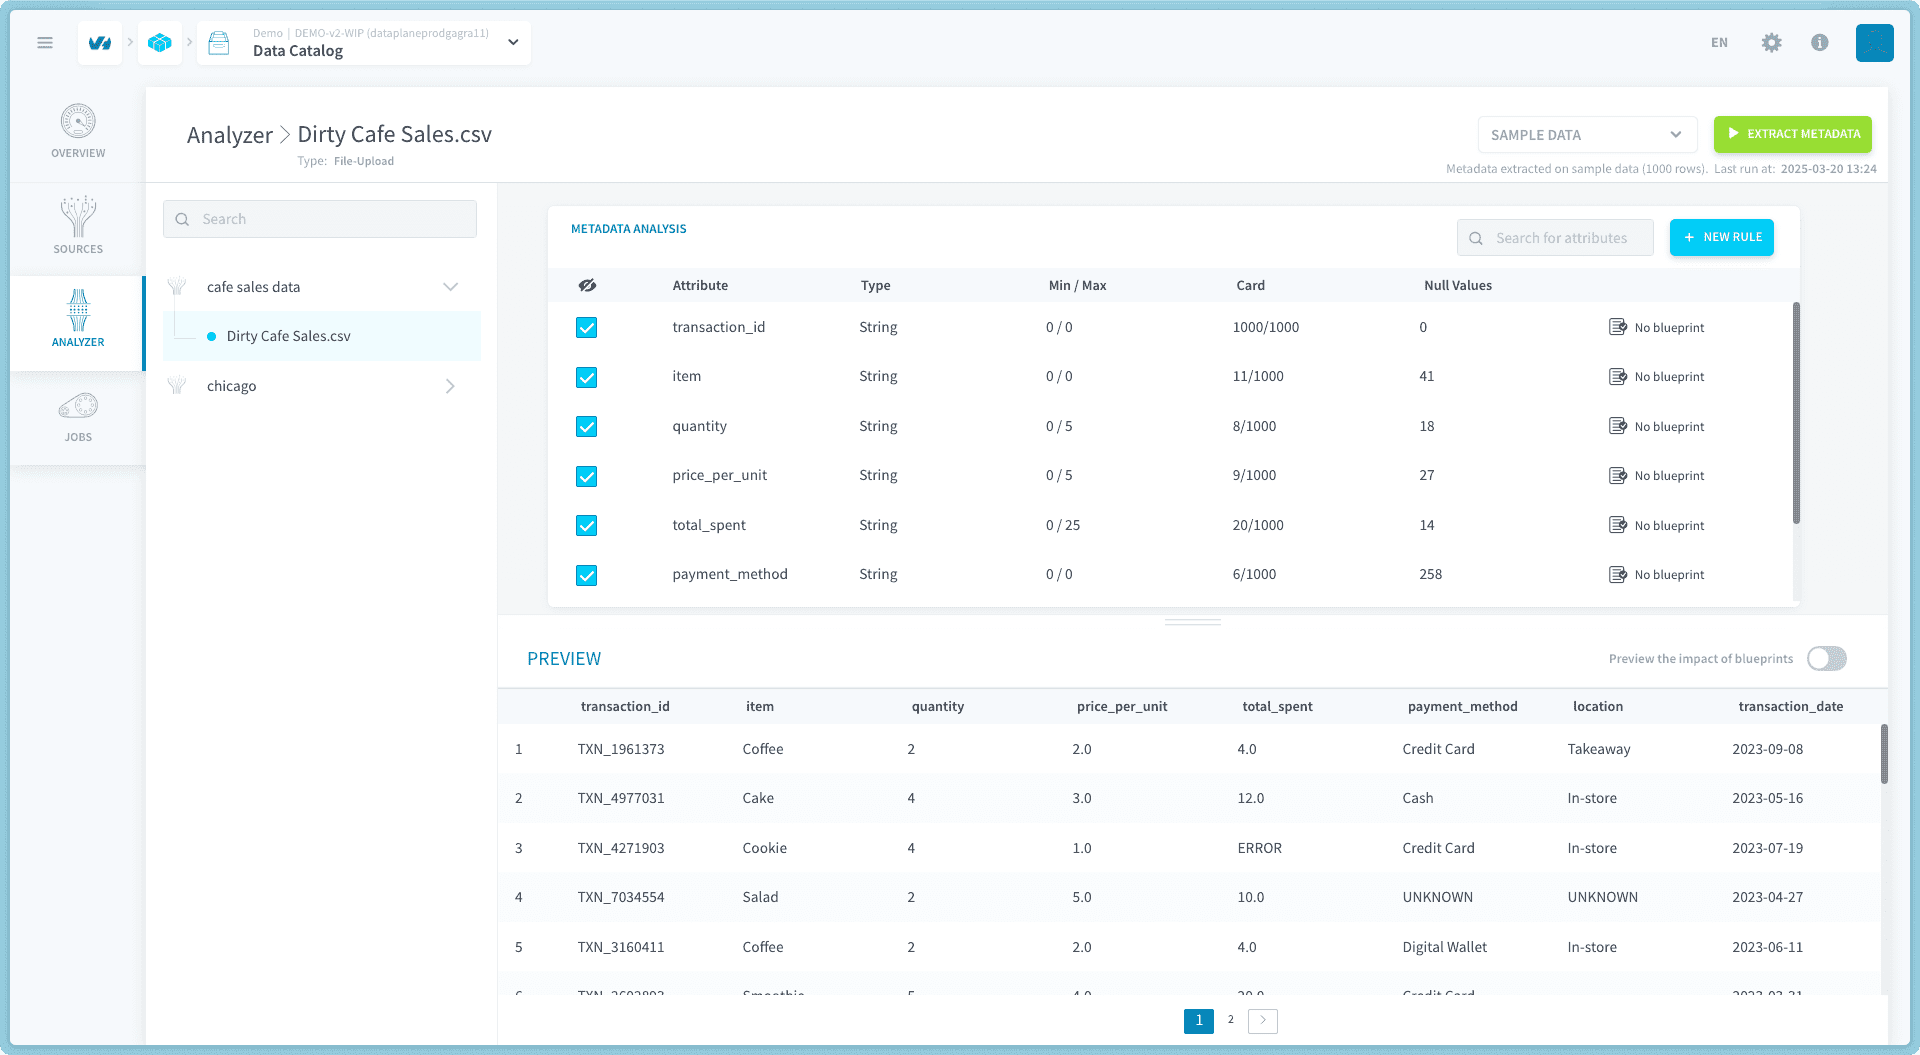
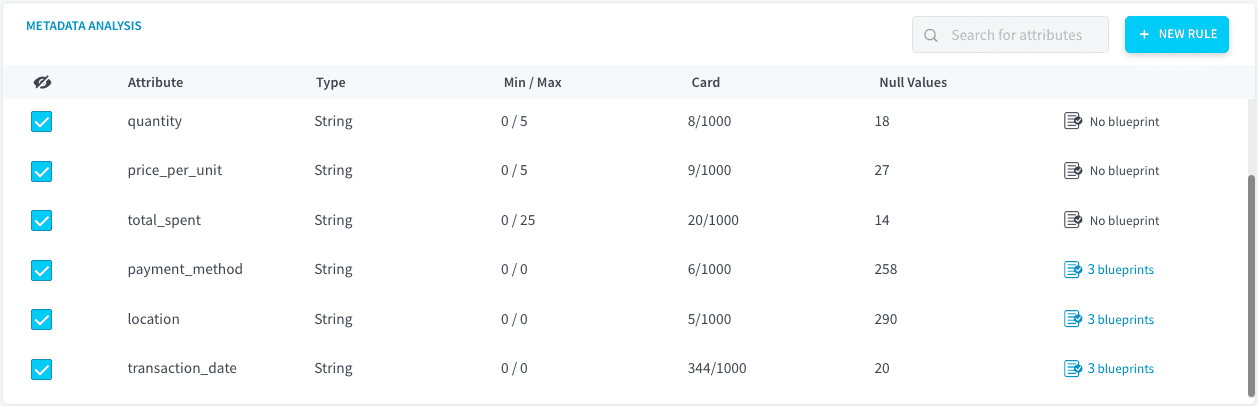
Once complete you can start to define the following blueprint rules for each of the mentioned attributes:
step 3 - Create table from source
- Open the tables section by going to the Lakehouse Manager.
- Click on Create from a Connectors source and select the source
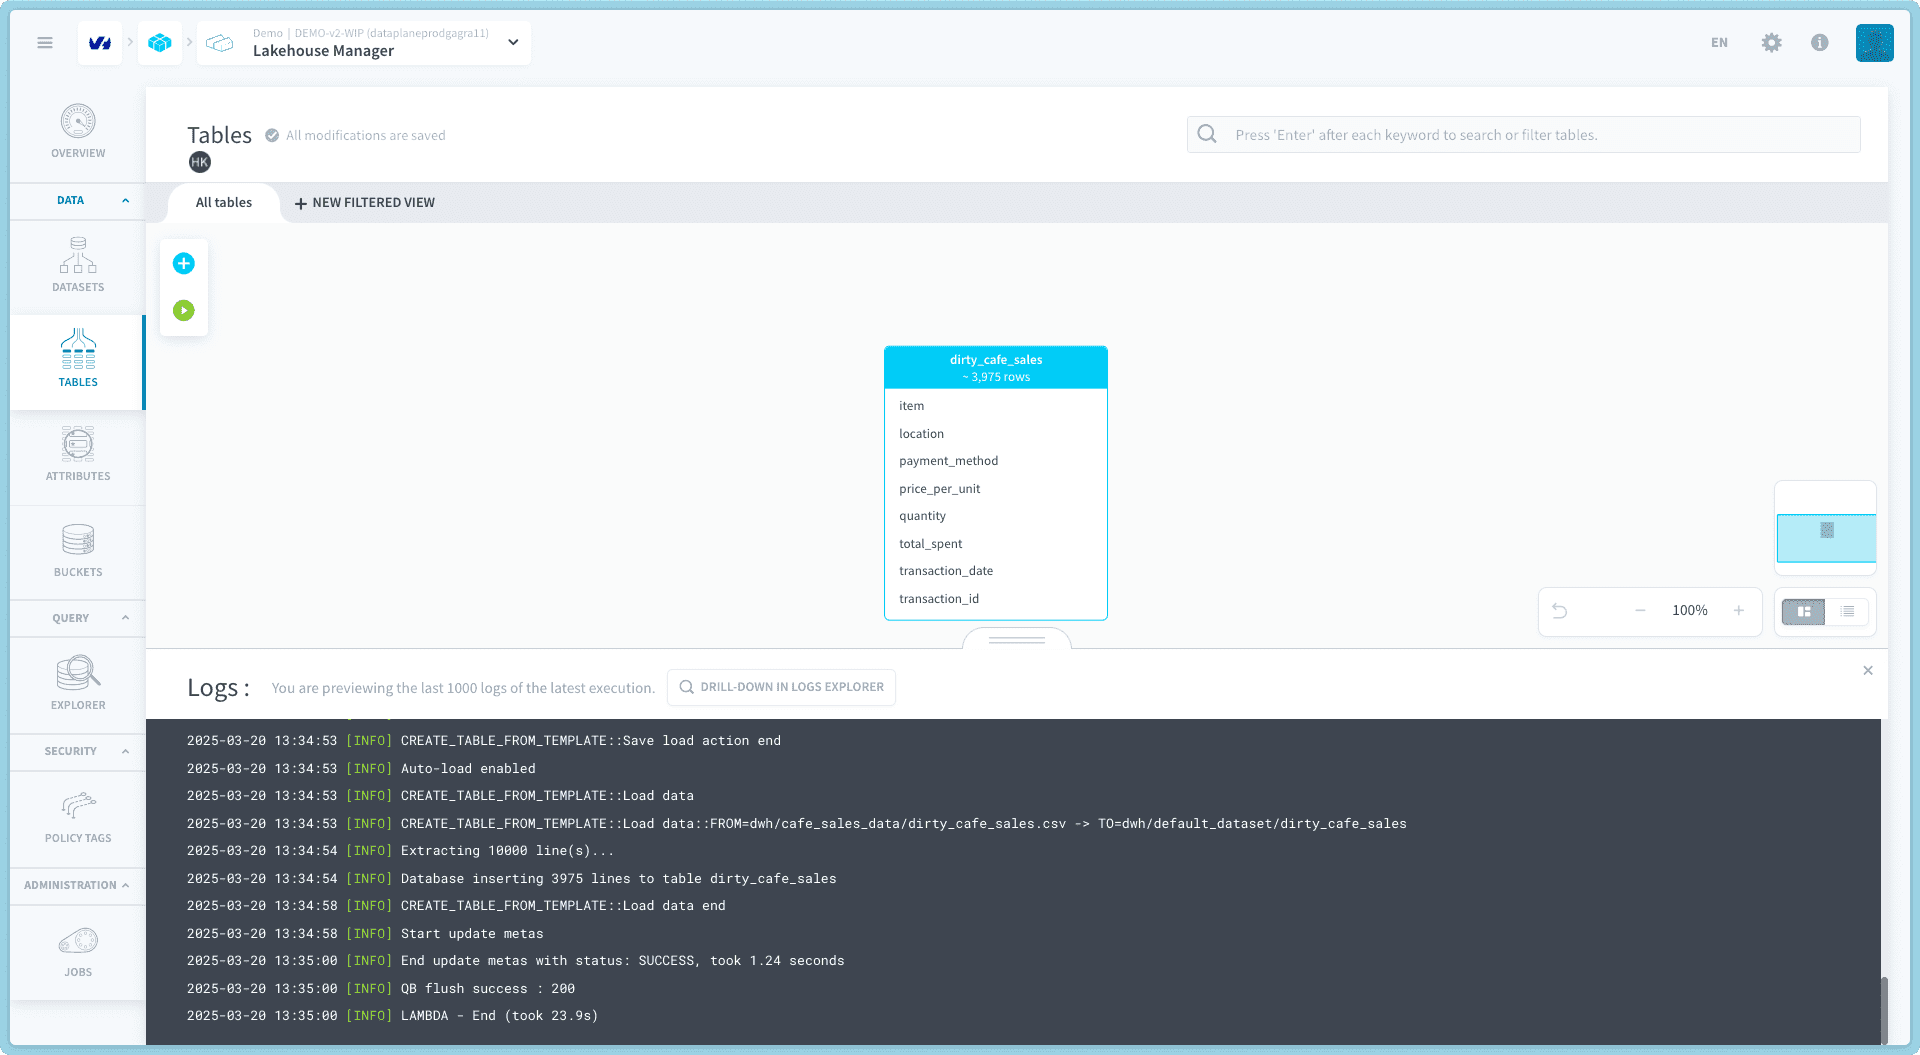
dirty cafe sales.csv. - Name it dirty_cafe_sales (default name)
- Click on Create to build and create the table.
- Verify that the table has been created correctly. If there are any issues, check the logs for errors.
step 4 - Duplicate the table
Duplicate this table to get a new empty table with the same attributes and name it clean_cafe_sales. Launch the "Build" and check that everything's okay after completion.
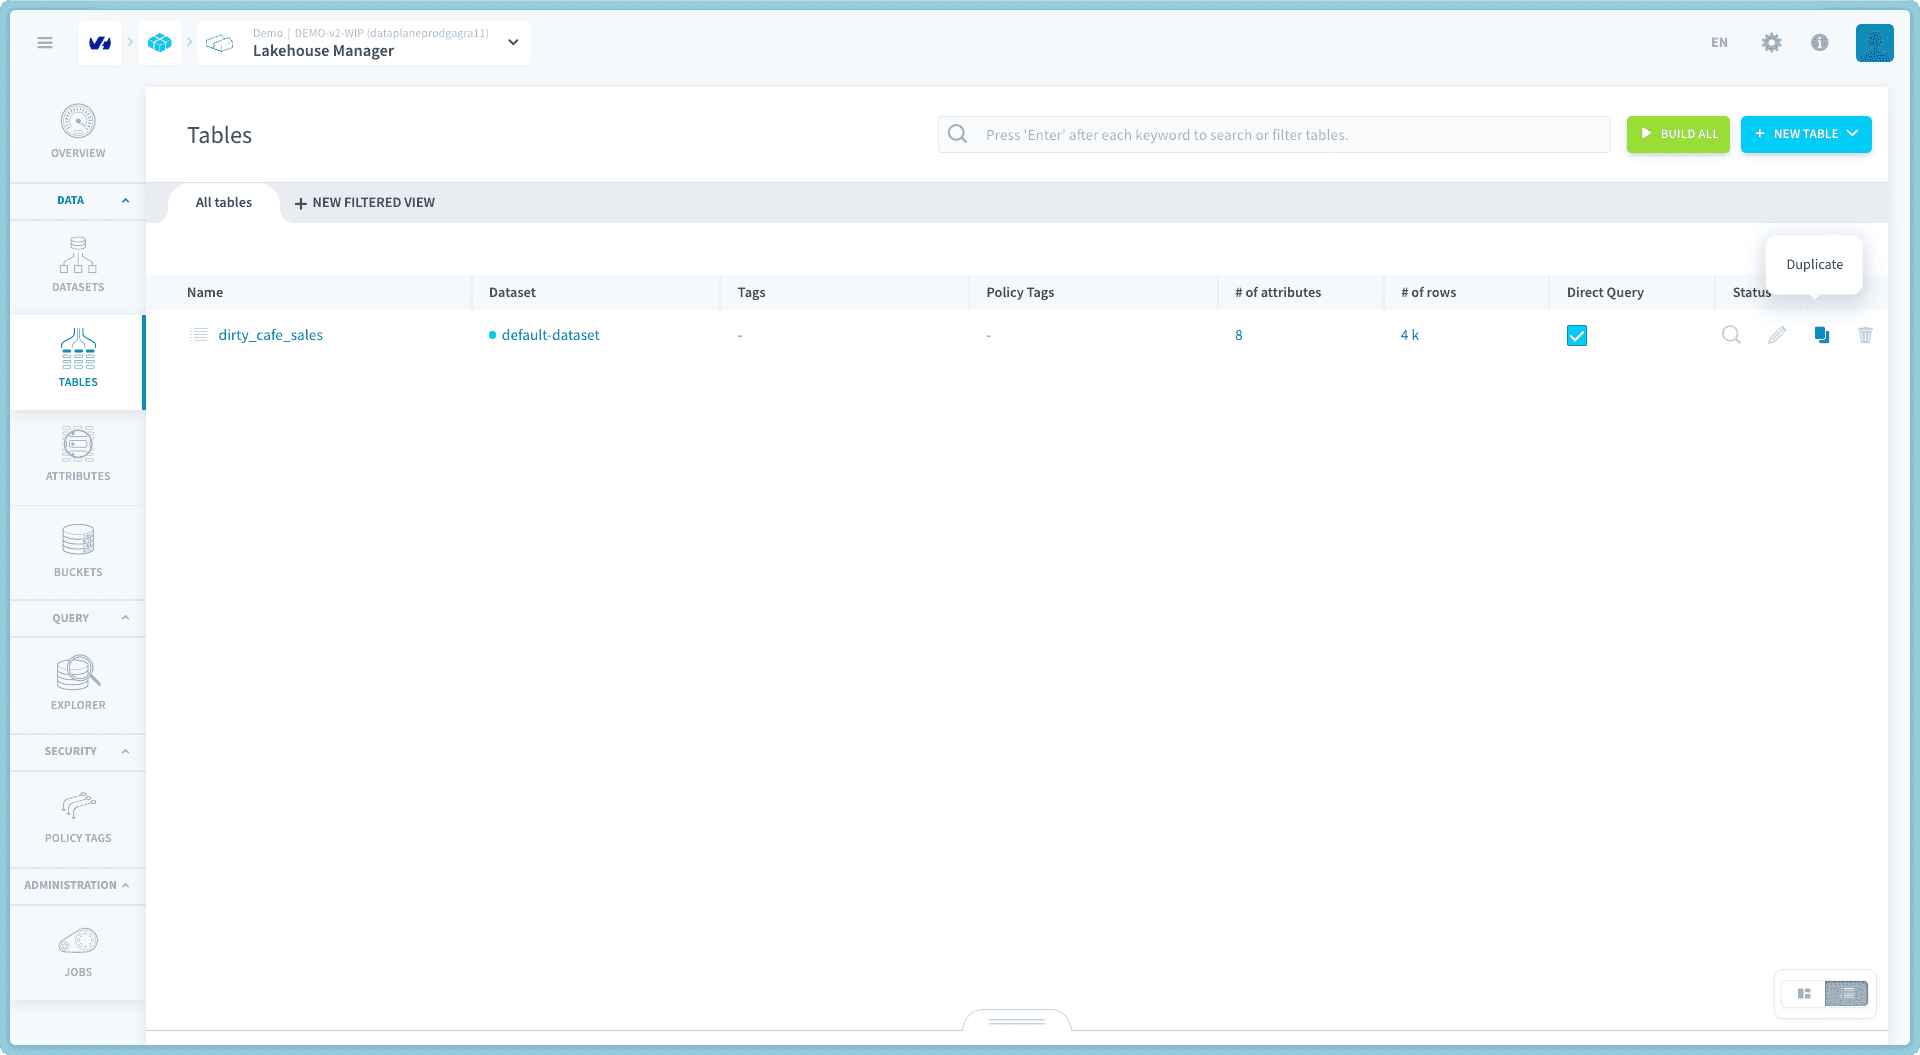
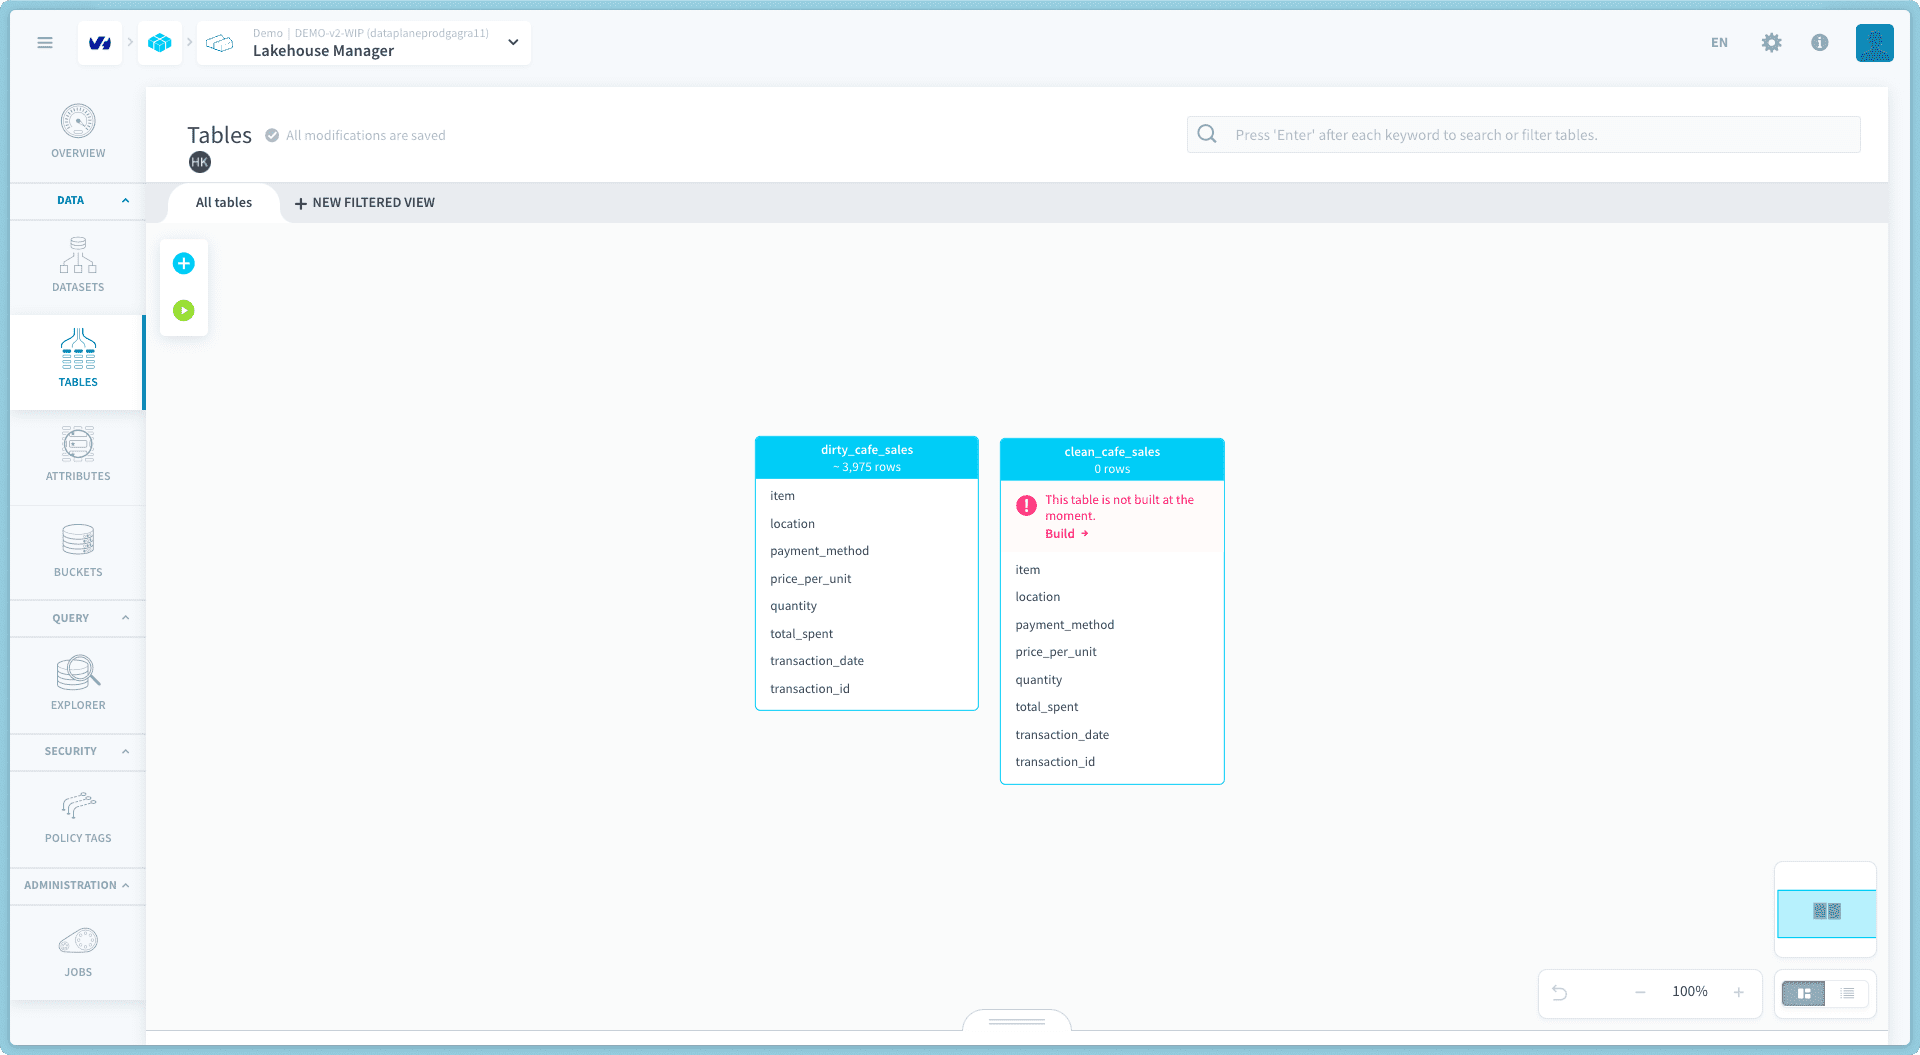
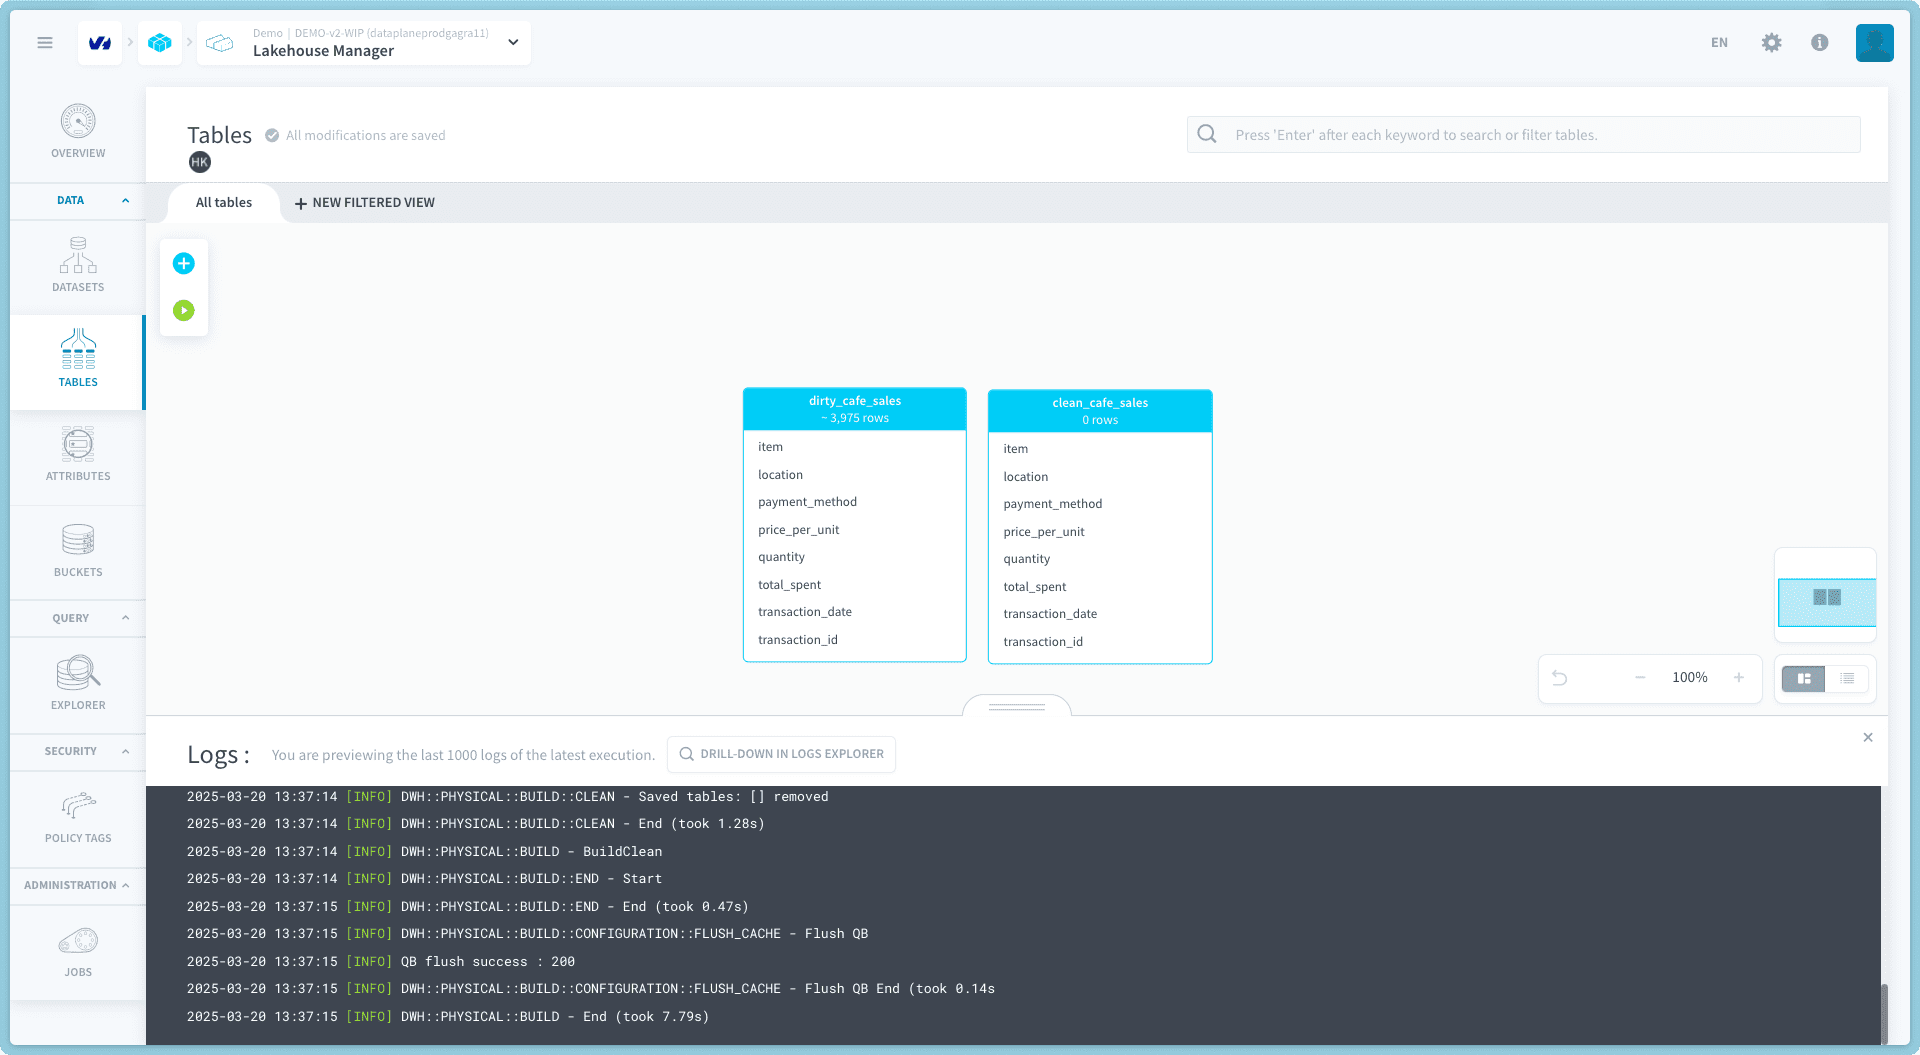
As noted, the duplicated table is currently empty. This occurs because only the table attributes have been duplicated, while the corresponding data still needs to be loaded separately.
step 5 - Create an empty table for future data visualization
Create a new empty table called clean_dataset_history and add the following attributes:
Tip: You can switch to the Canvas view to easily drag and drop the attributes, instead of creating them individually.
- item
- location
- payment_method
- quantity
- total_spent
- transaction_date
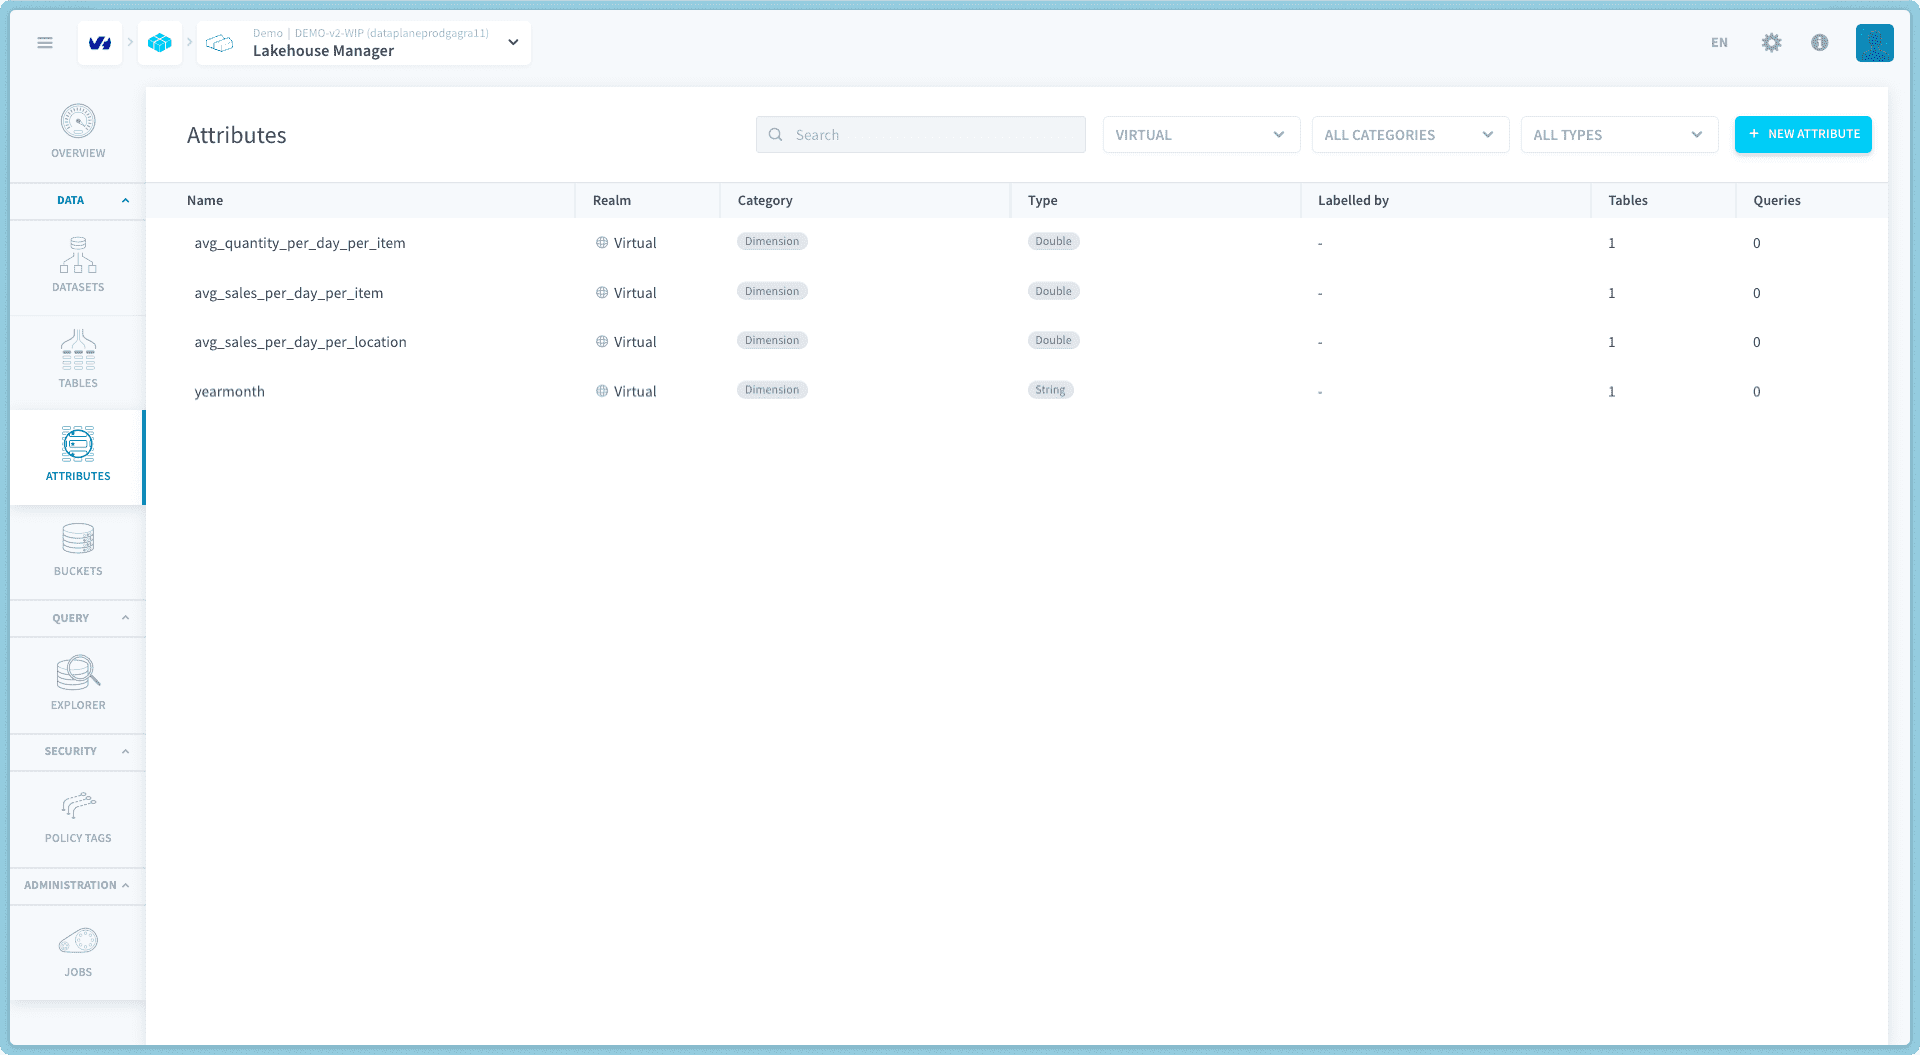
step 6 - Create new attributes
Head to the Attributes in the Lakehouse Manager, create new Virtual Attributes for data visualization:
it should look like so:
Processing Options
You now have two options to process and analyze your data:
Option 1: Automated Processing (Steps 7-9)
- Automate processing with workflow and visualize data for custom analysis
- Create a Data Processing workflow with custom action using a Python script + an Aggregate action (for automation and efficient dataset processing)
- Create Queries from Analytics Manager to do data visualization using the previously created attributes
Option 2: Step-by-Step Processing with LLM (Steps 10-11)
- Process data step-by-step and benefit from LLM API endpoints for a complete data analysis
- Use a Jupyter notebook to process your dataset step-by-step
- Benefit from powerful LLMs available on AI Endpoints to do a complete data analysis and generate a report
Option 1: Automated Processing
step 7 - Clean dataset using your own data processing workflow
If you want to process data quickly and be able to launch it with a single click, you can create a workflow with custom and aggregate actions from the Data Processing Engine.
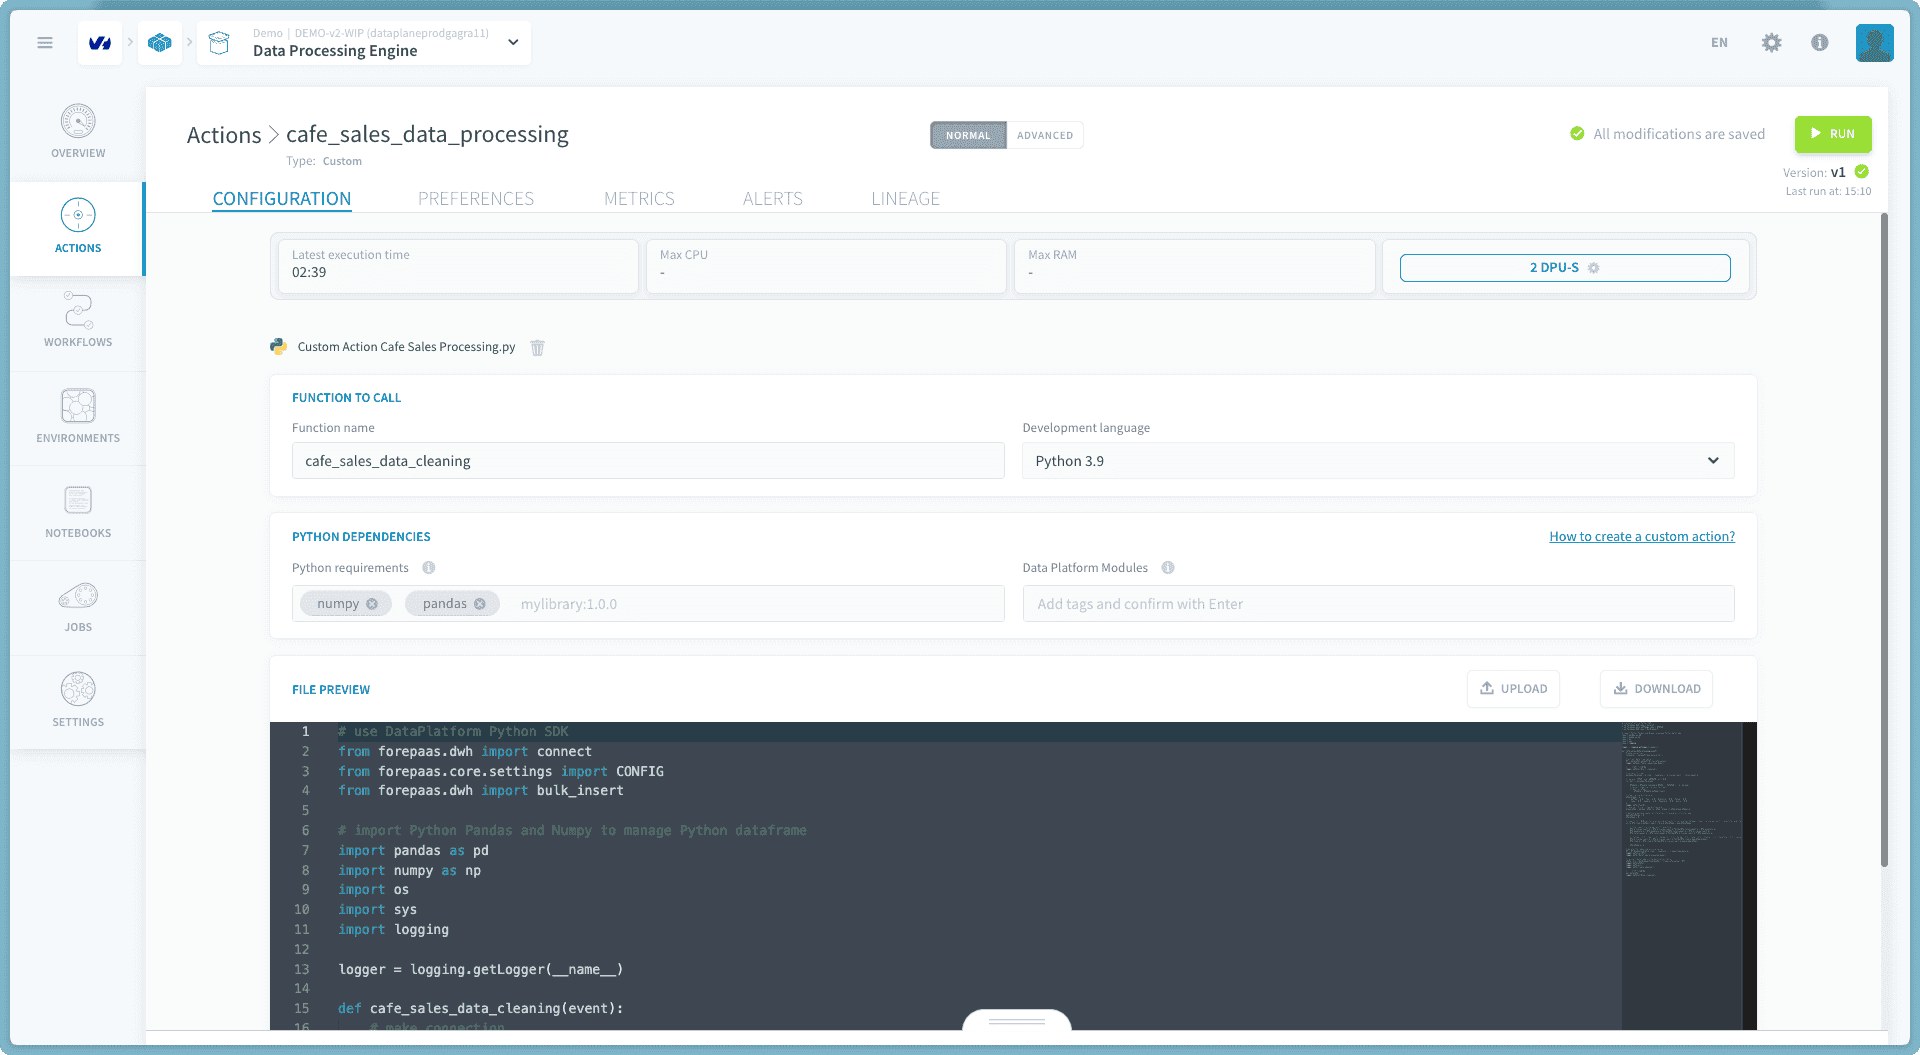
- First, create a new "Custom" action:
- Upload your Python file
custom_action_cafe_sales_processing.py - name the custom action as
cafe_sales_data_processing - Choose Python 3.9 version
- Add
numpyandpandasdependencies (type in the library name and press enter) and click on Create - Now you can RUN the custom action.
Also, you should see logs similar to below to double check if what you have done is correct:
-
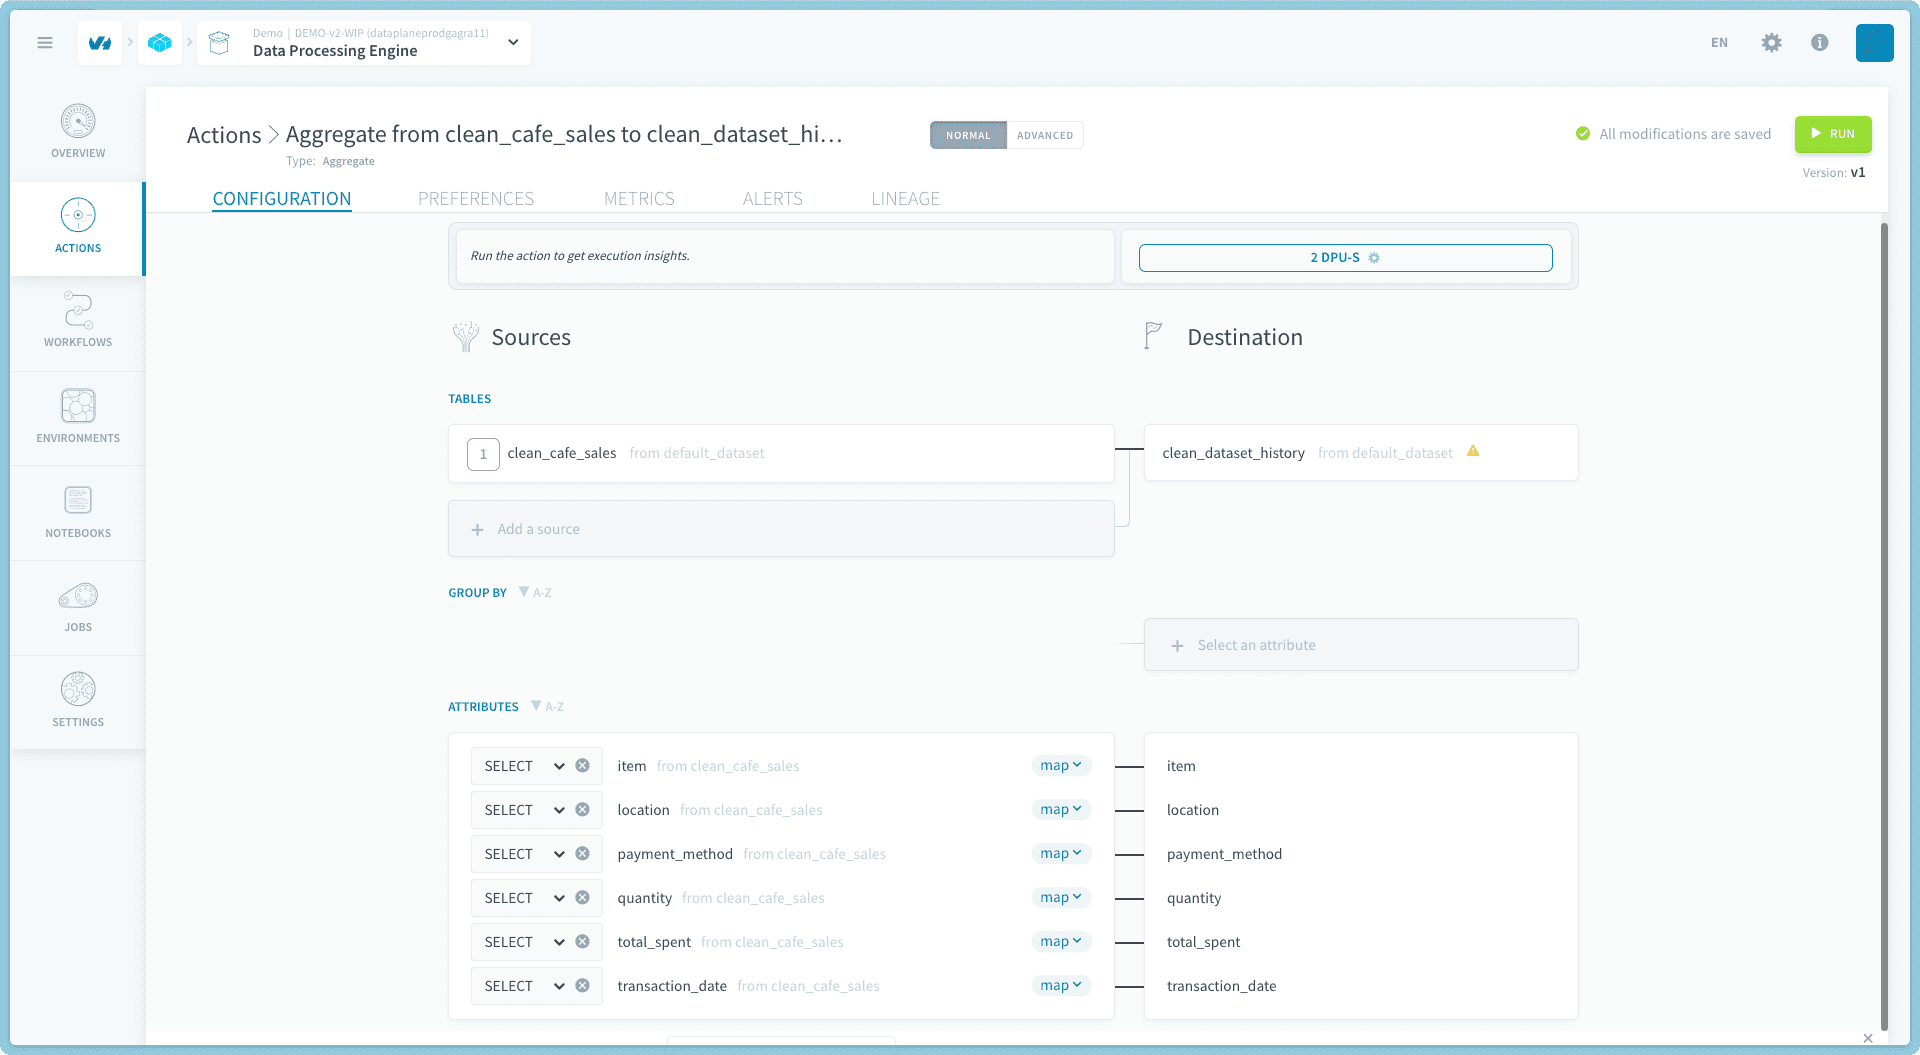
Then, create the "Aggregate" action as follows:
- Configure the aggregate action settings according to your requirements
-
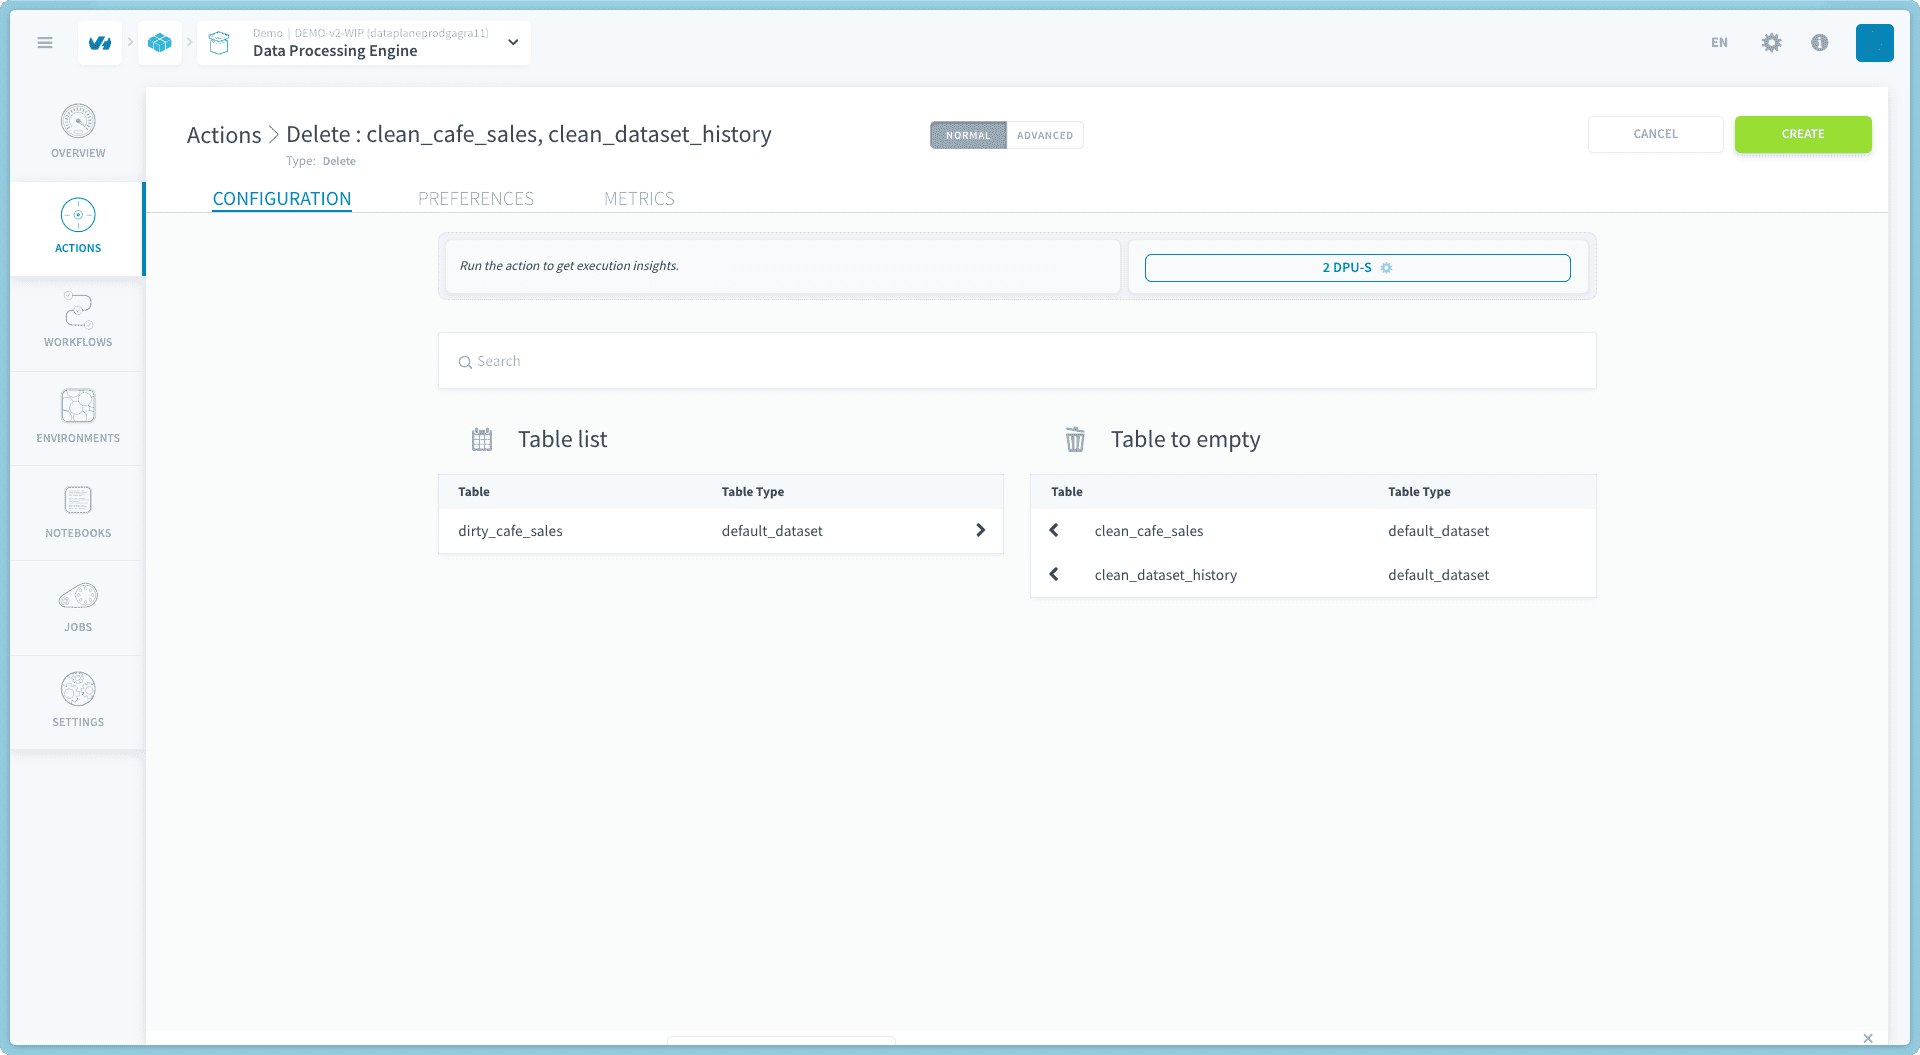
Then, create the "Delete" action as follows:
- Configure the delete action settings according to your requirements (this action will ensure you are using a clean table every time)
-
Finally, define the processing workflow:
- Set up your workflow to connect the delete, custom action and aggregate action
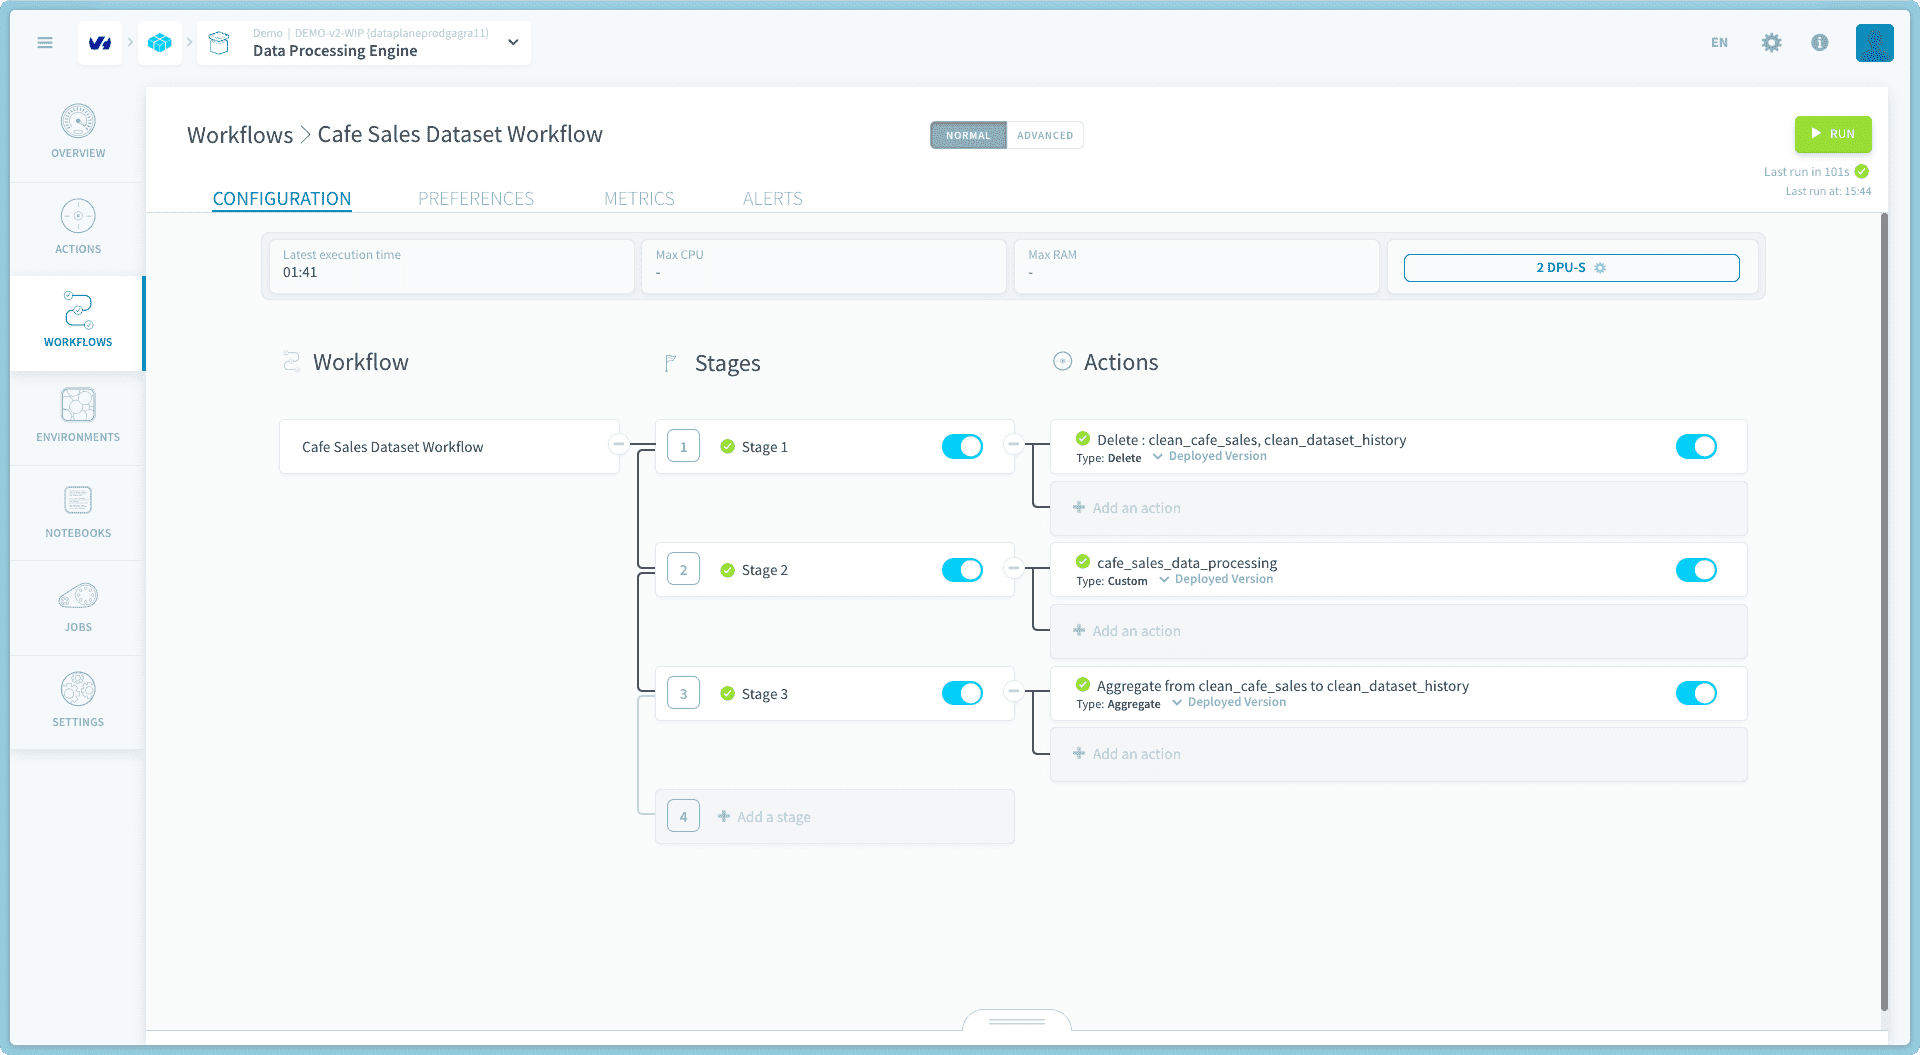
Your dataset is now clean.
step 8 - Explore clean tables
Now, you can check if everything's okay:
-
From the Lakehouse Manager Tables, you should see your created tables
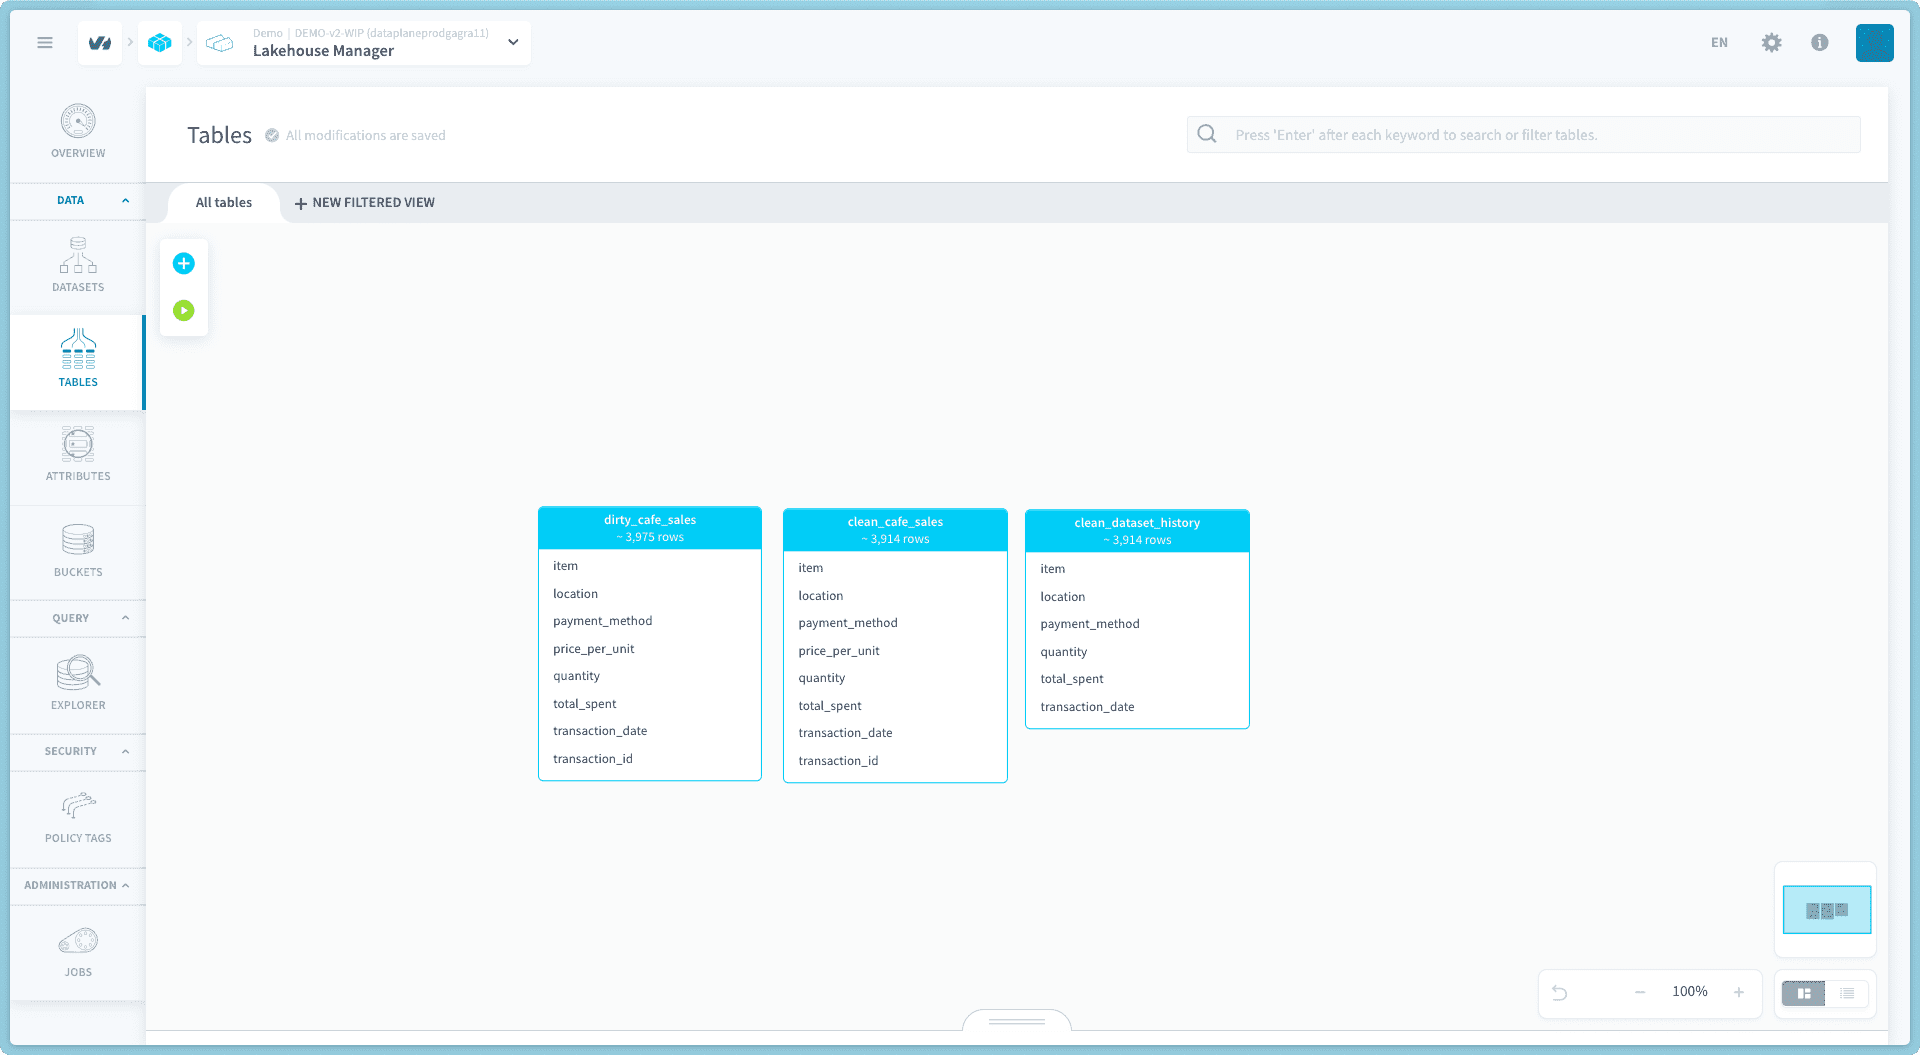
-
From the Lakehouse Manager Explorer, you can explore the
clean_cafe_salestable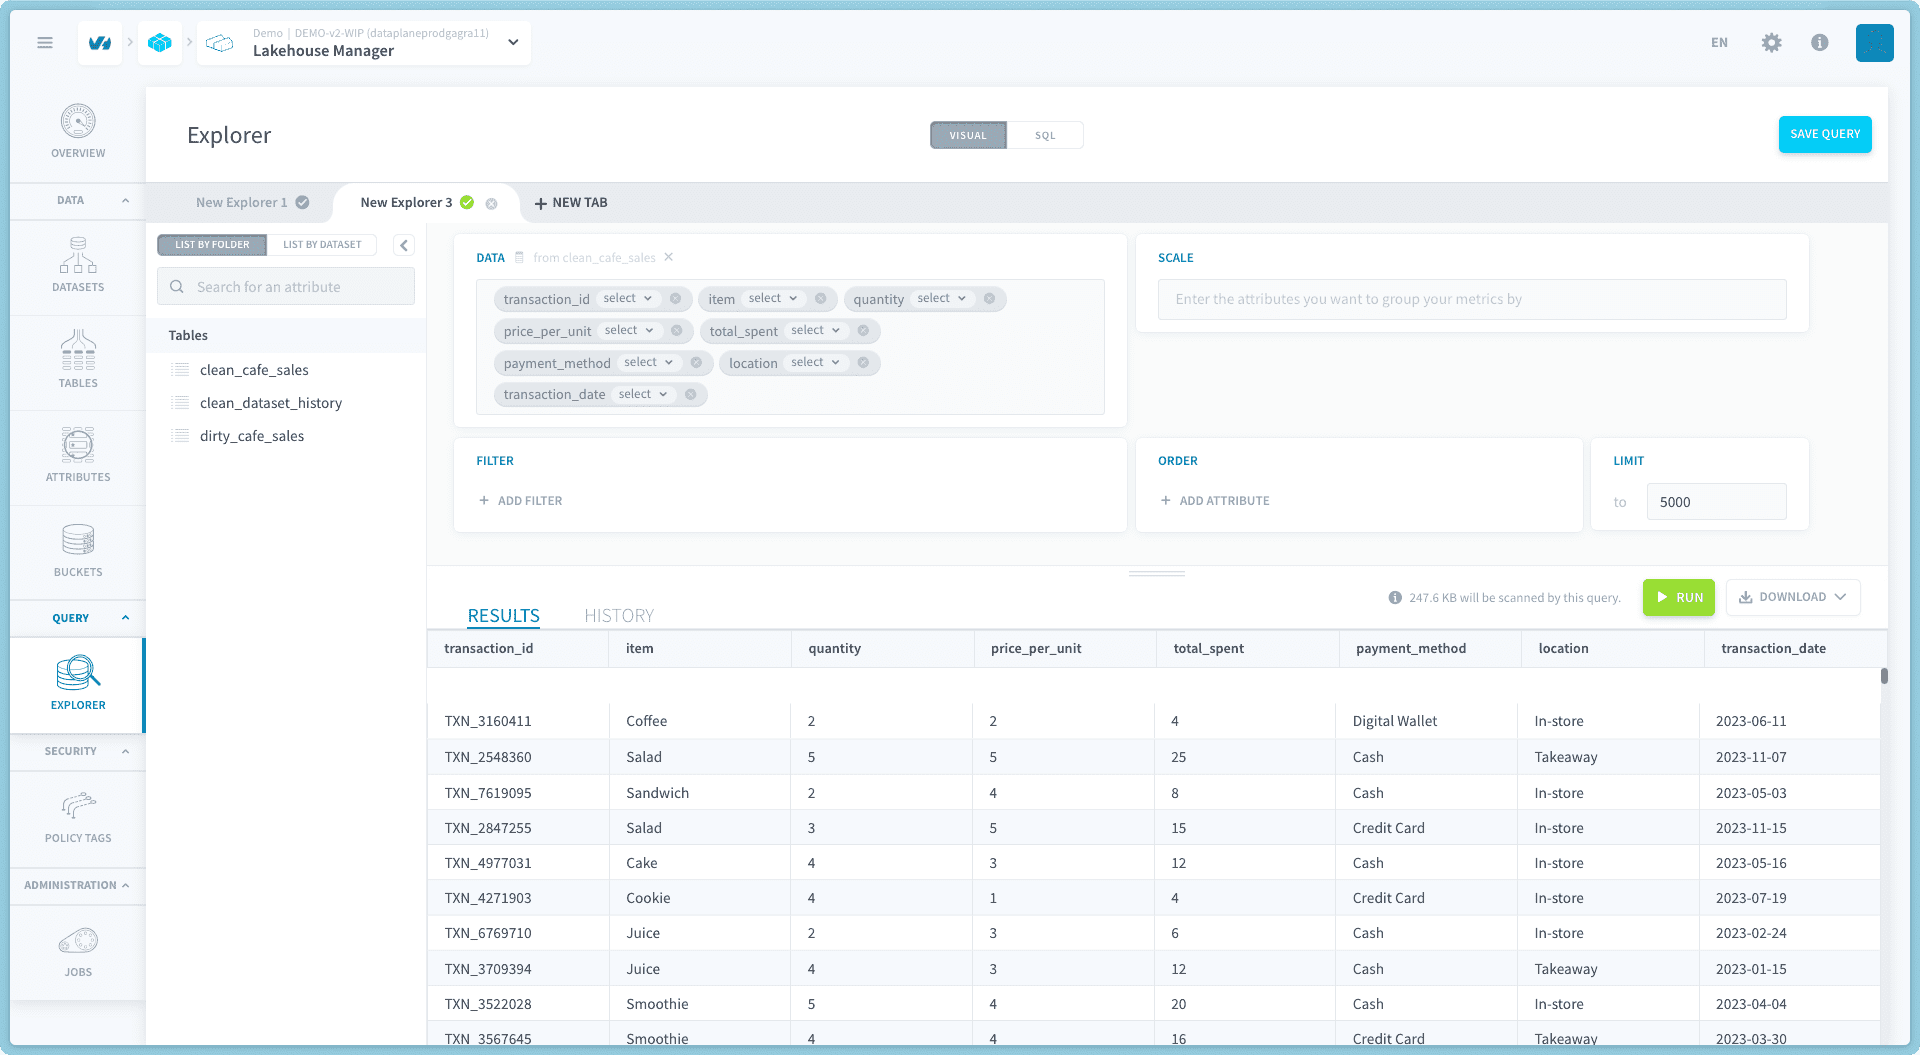
step 9 - Data visualization using custom attributes
Now we can take an even more closer look at our data visually with the help of queries in the Analytics Manager
-
Create quantity_per_item query
- You should see the average quantity sold per day for each item
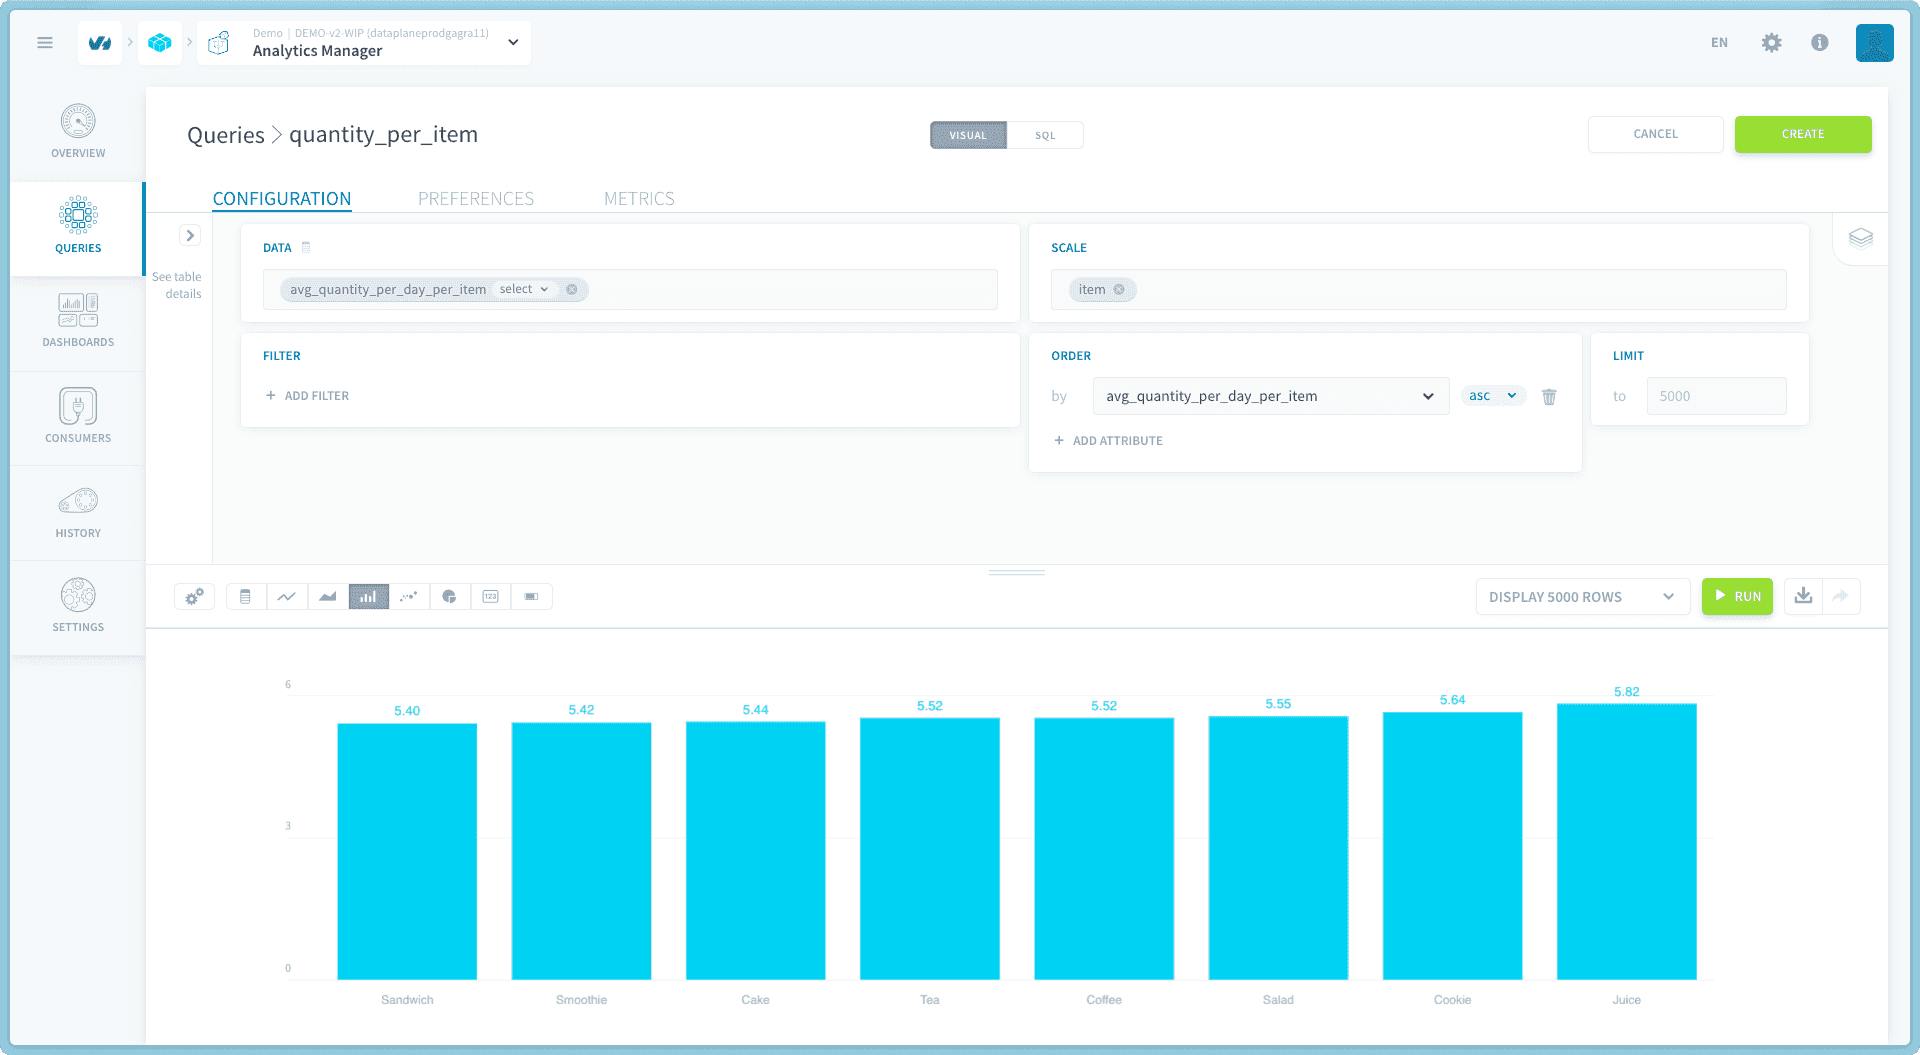
-
Create total_spent_per_item query
- You could see the average total amount sold per day for each item
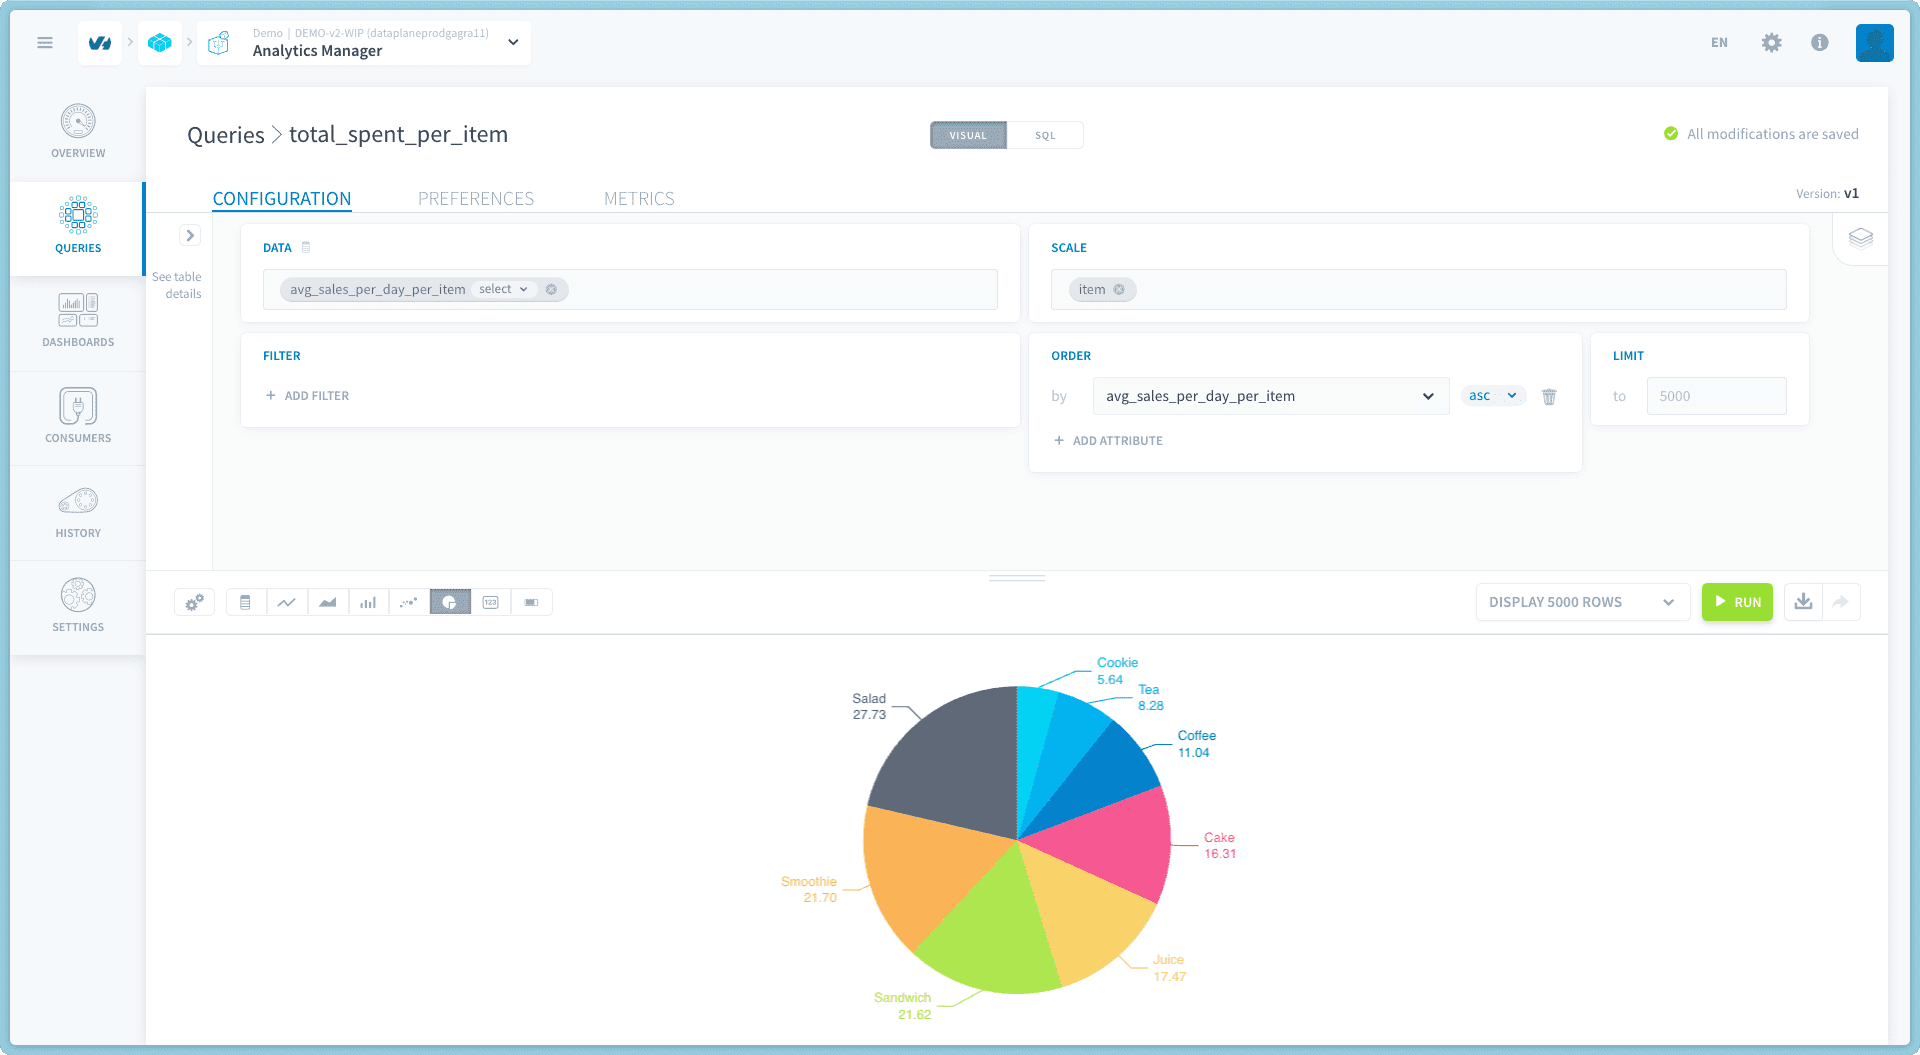
-
Create sales_per_location query
- You could see the average total amount sold per day for each location
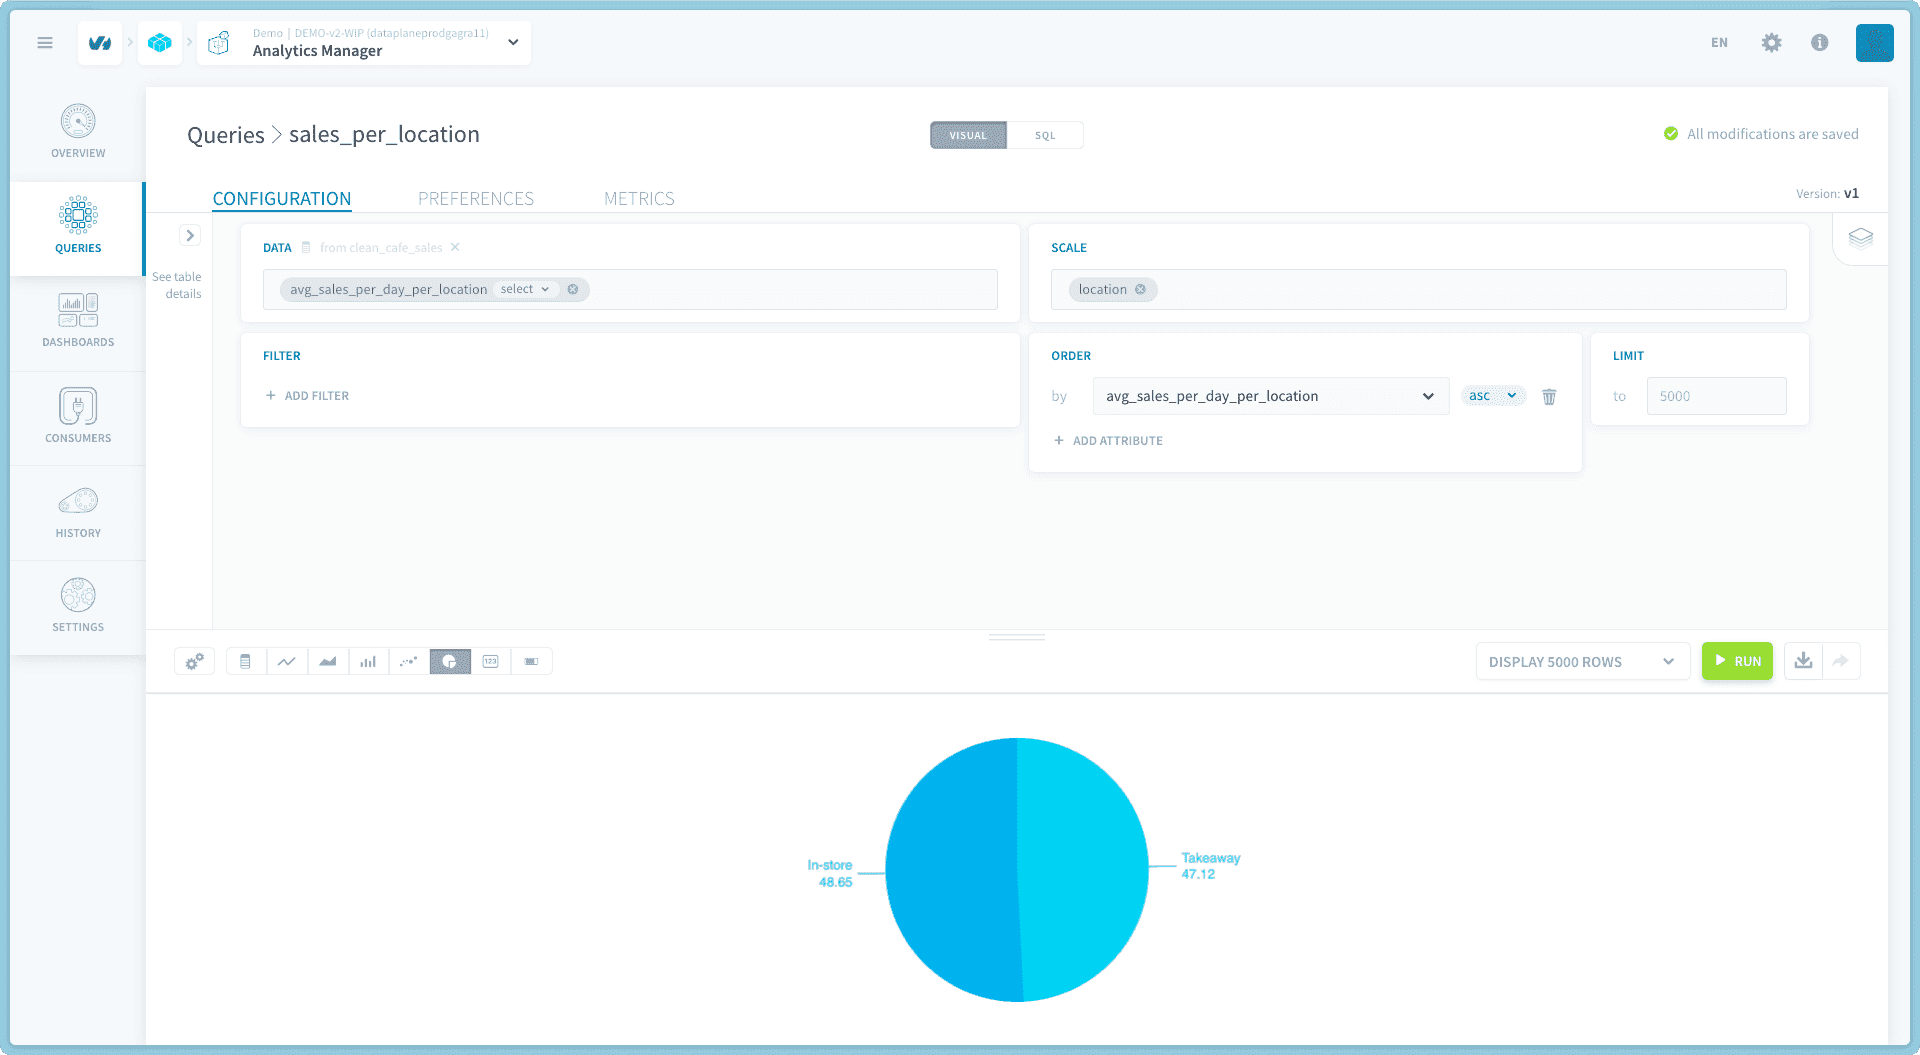
You can go further by creating more queries and then add them to a Dashboard which you can then share with others.
Option 2: Step-by-Step Processing with LLM
step 10 - Clean dataset and save it into S31 bucket
If you want to follow the data cleaning process step by step, you can create a new notebook from the Data Processing service.
-
Create a "Base notebook" with:
- Python 3.9 version
- Install
numpy,pandas,matplotlib, andseaborndependencies
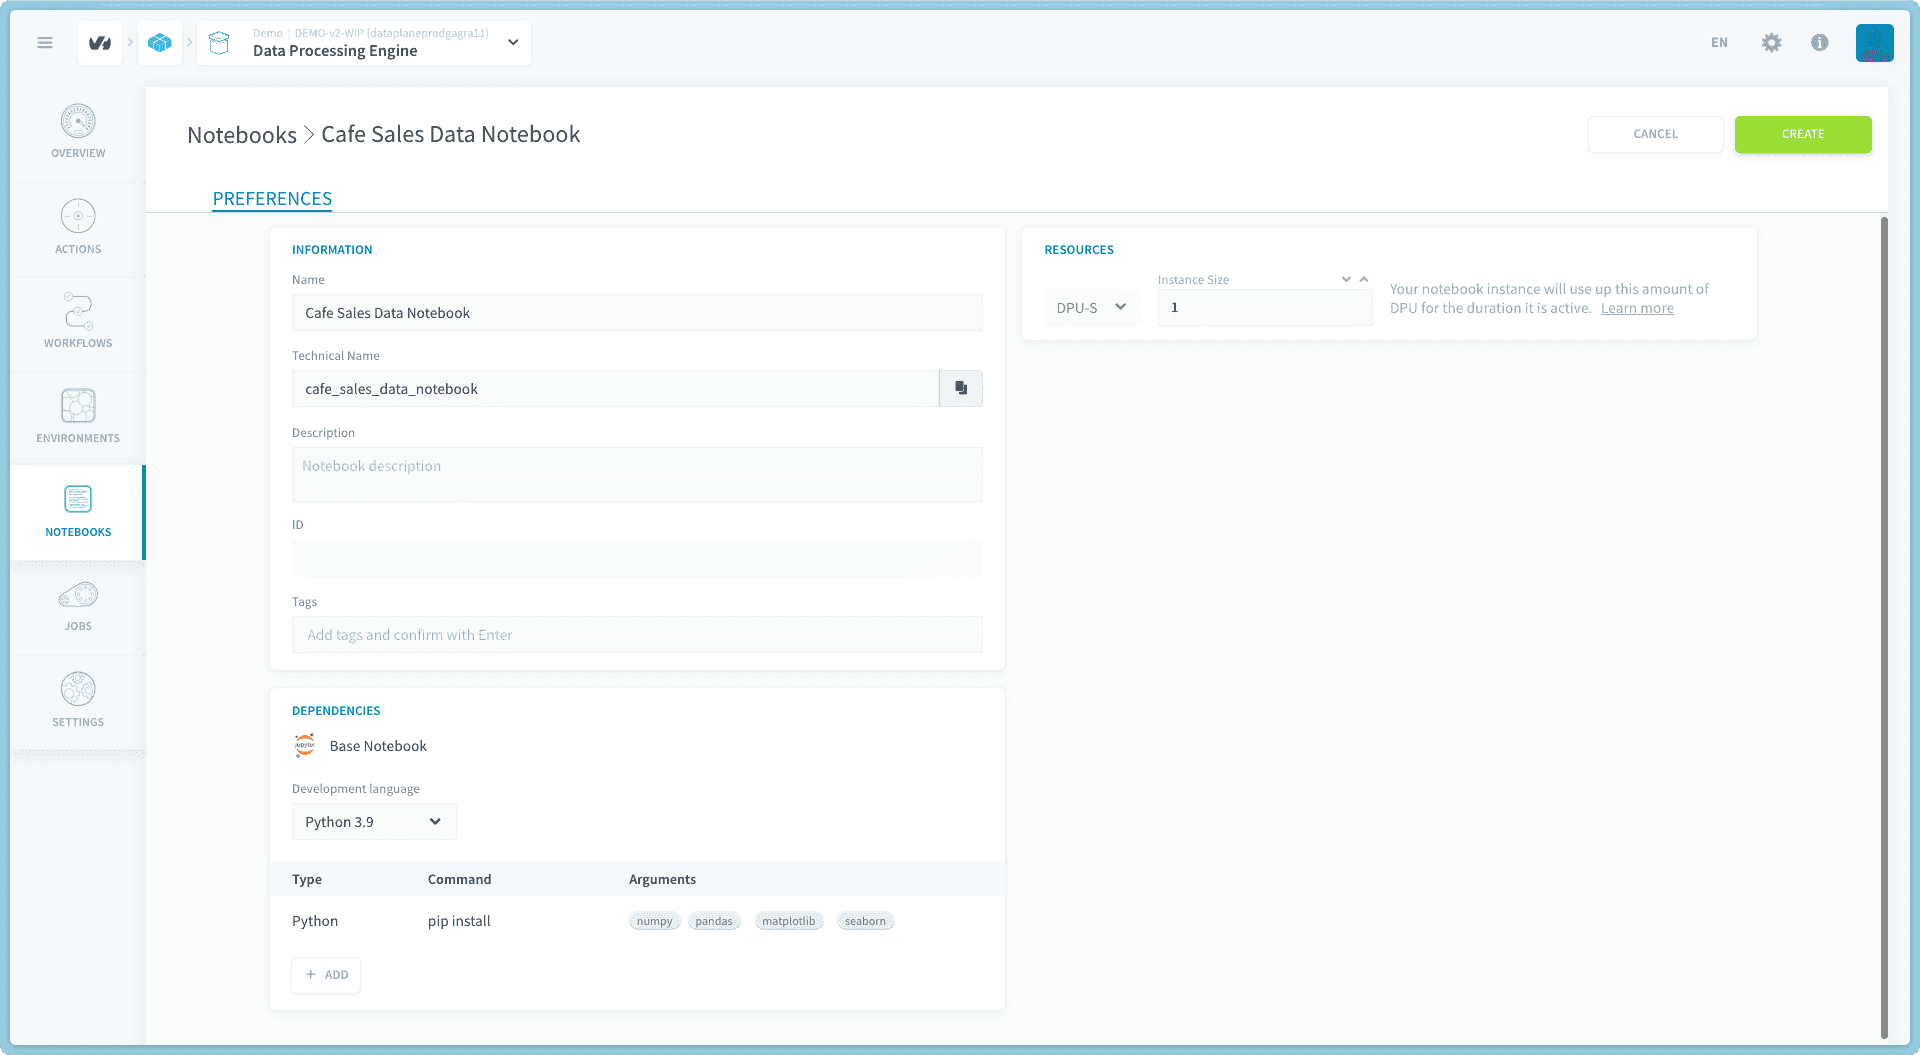
-
Drag and drop the or click upload, to upload the file
cafe_sales_preprocessing.ipynbinto the jupyterhub file siebar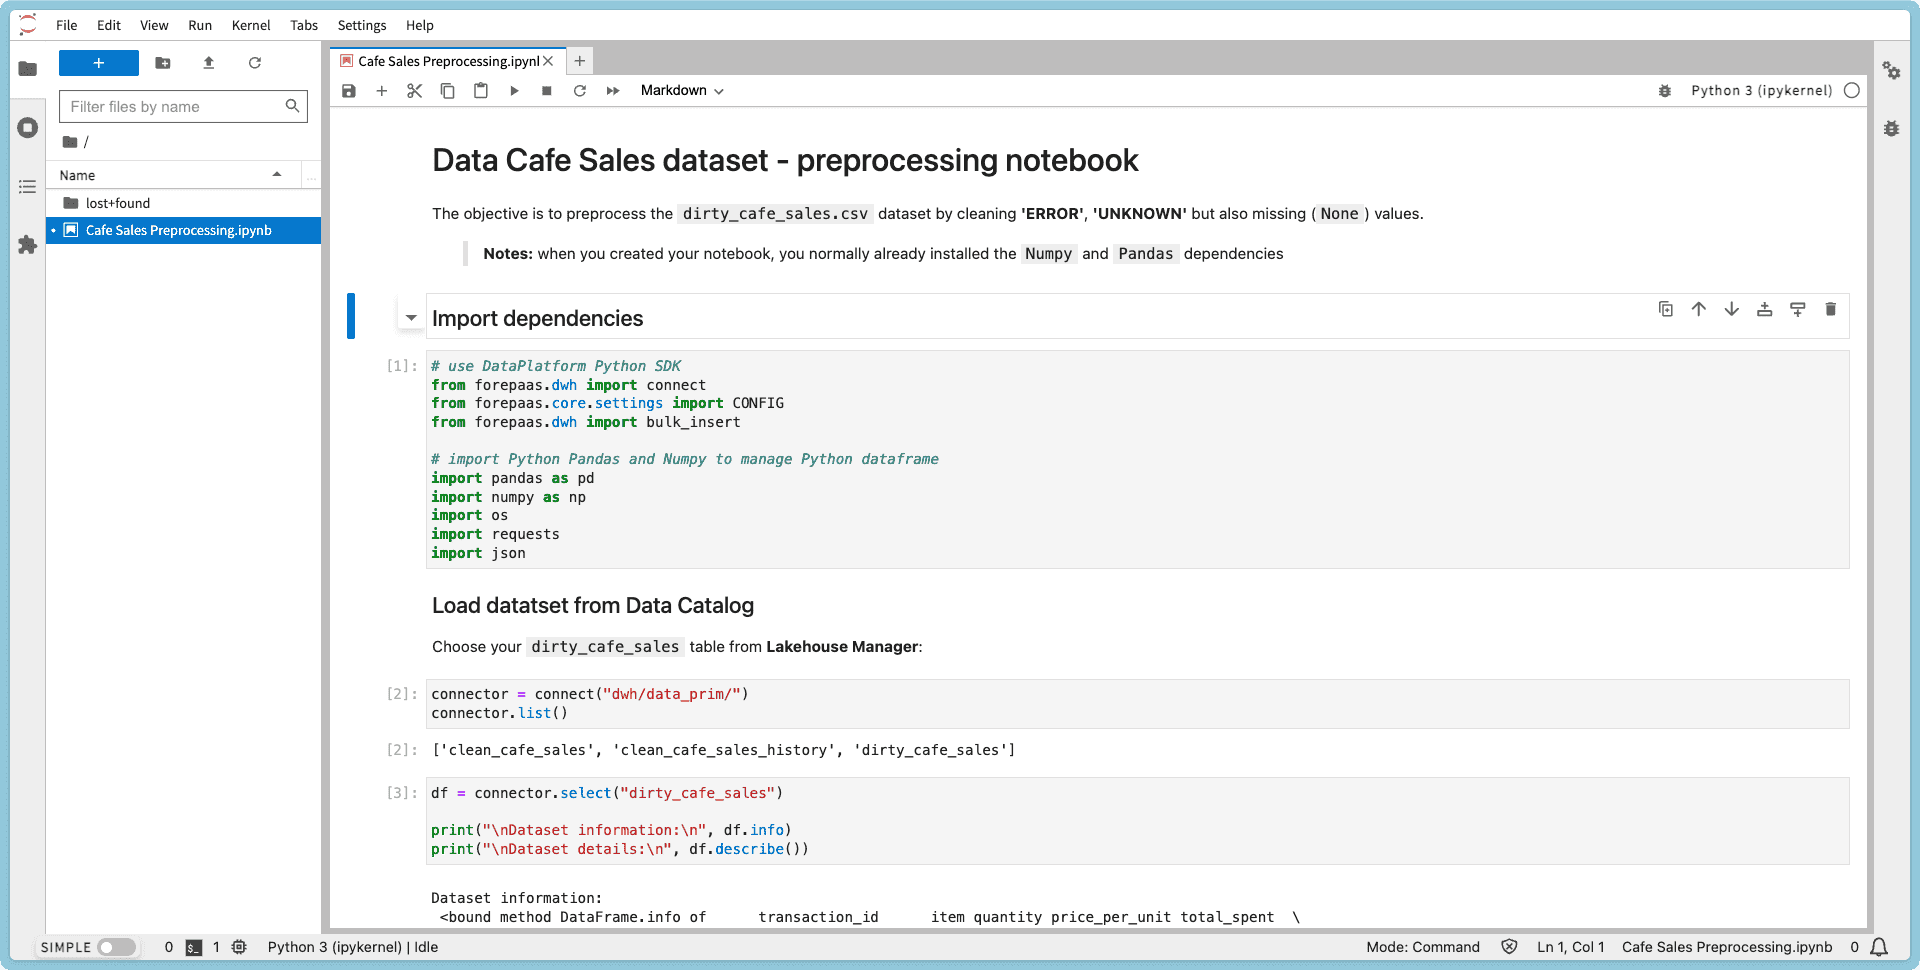
step 11 - One-shot data analysis with LLM AI Endpoints
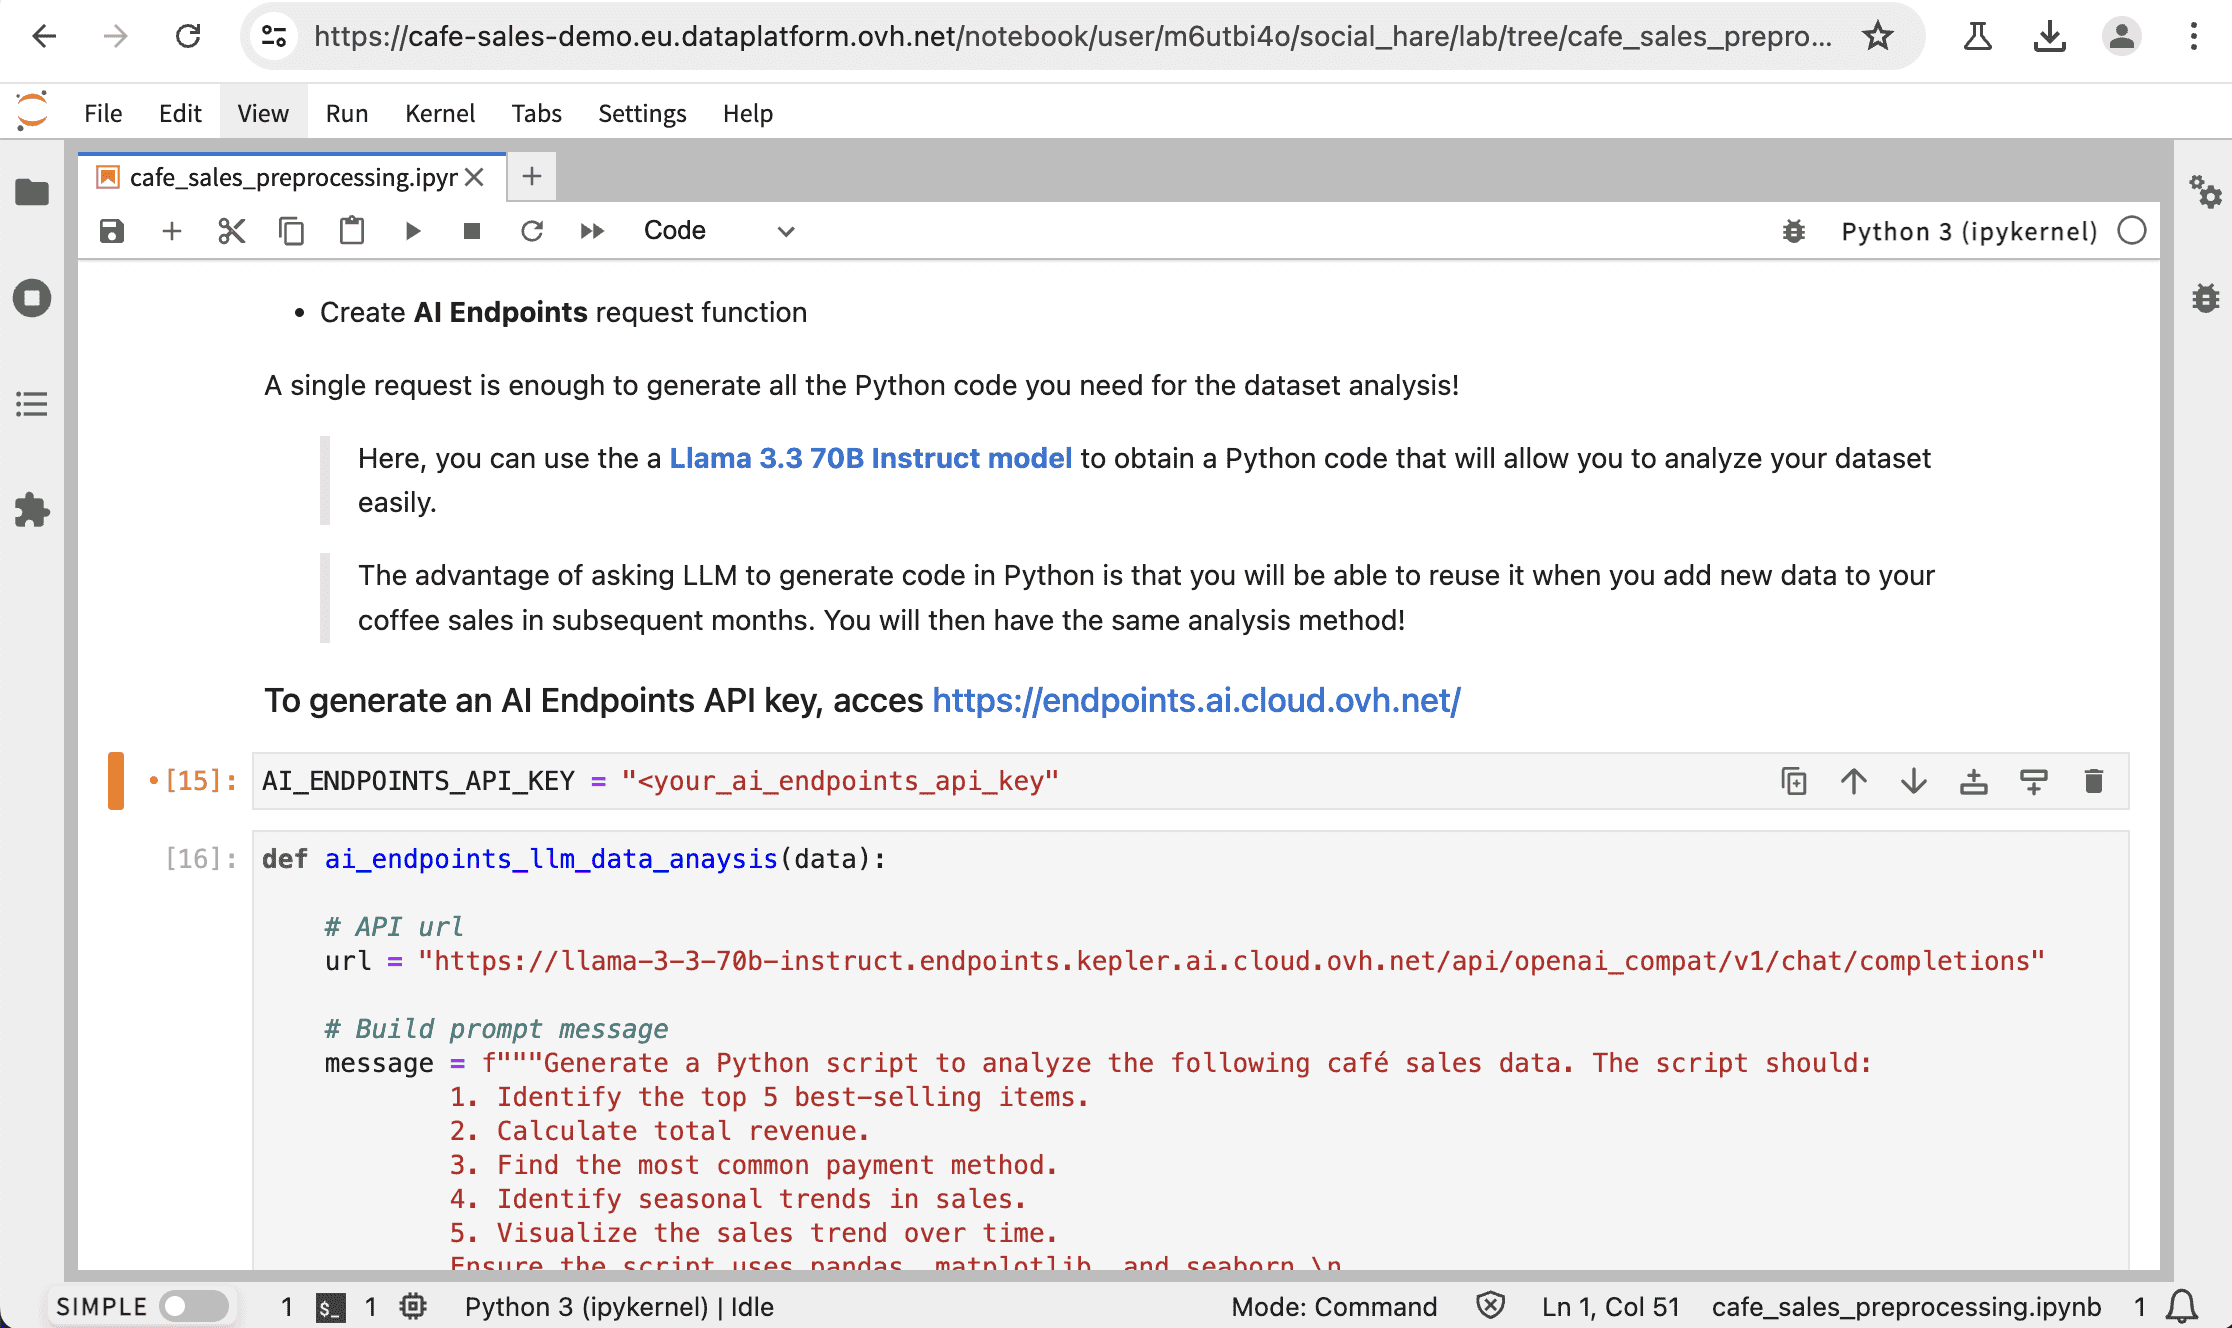
A single request is enough to generate all the Python code you need for dataset analysis!
-
Use the Llama 3.3 70B Instruct model with the Python code that will allow you to analyze your dataset easily
-
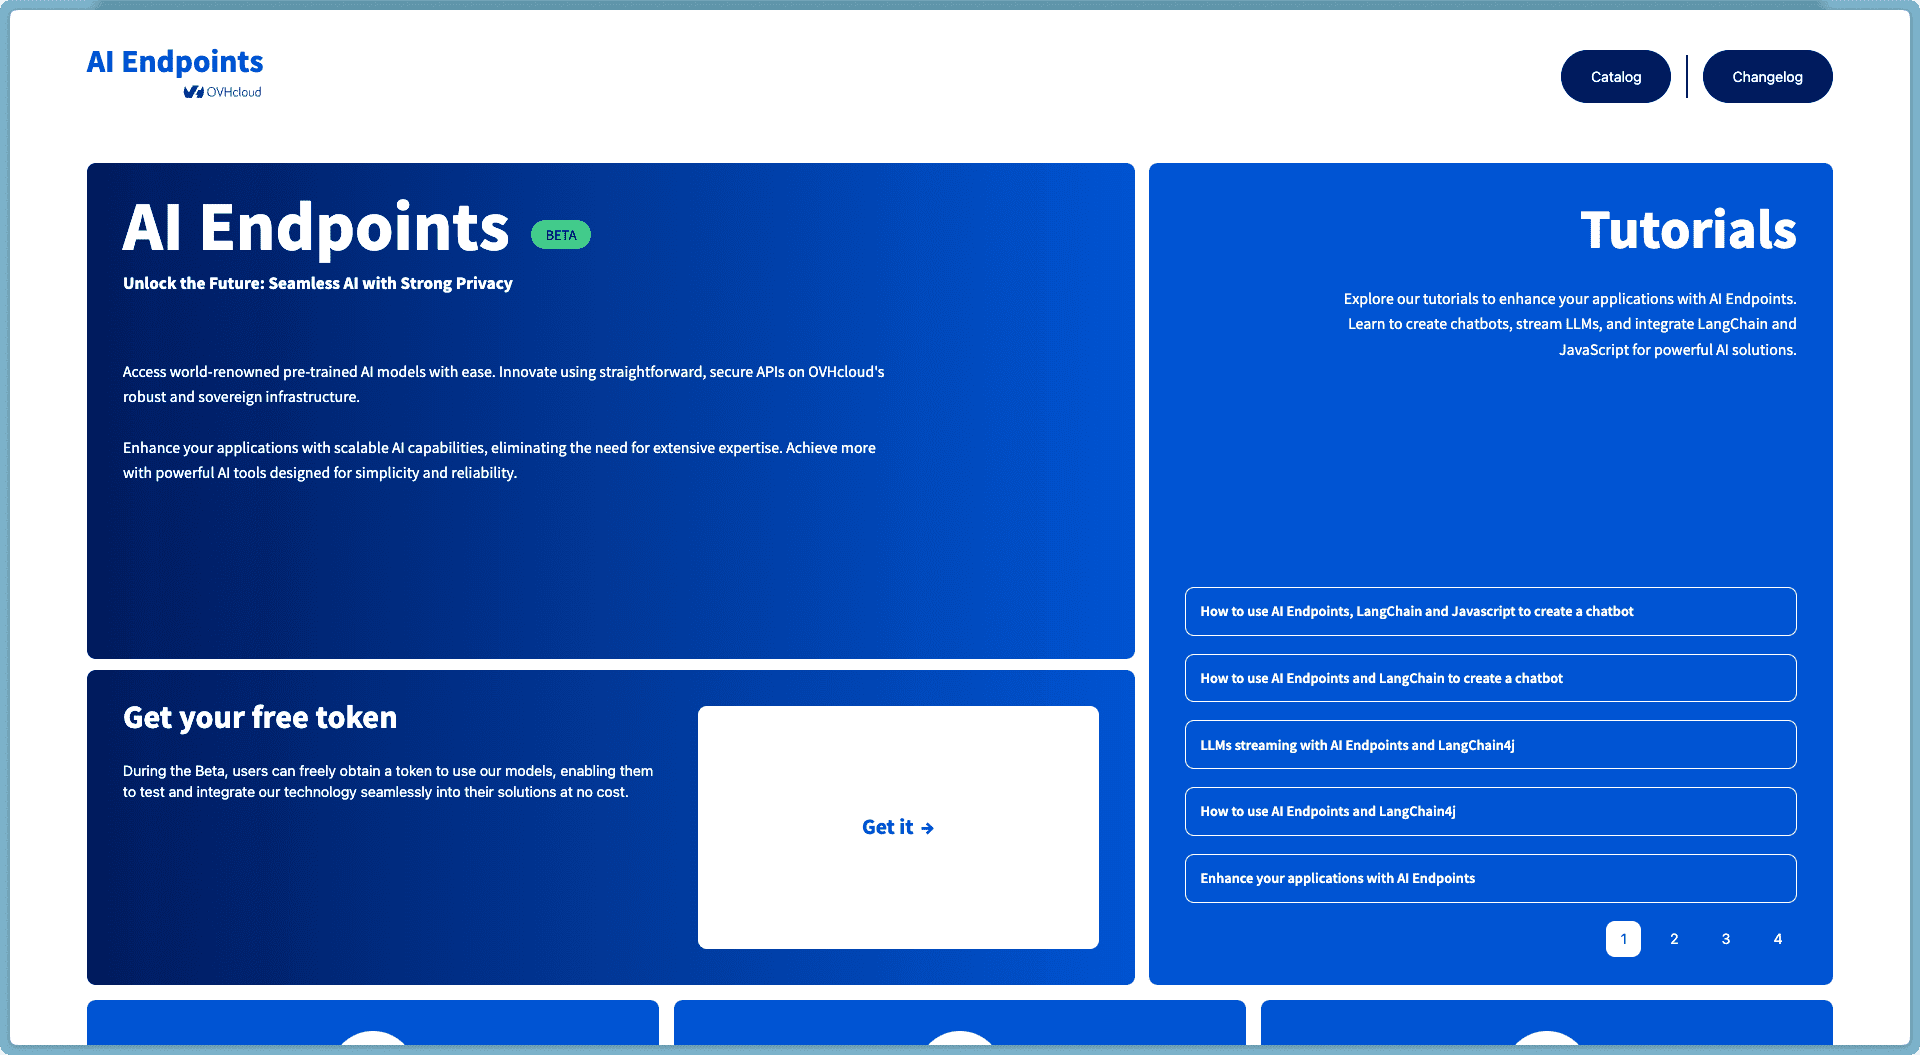
Generate an AI Endpoints API key and use it in the designated line as seen below in the screenshot
- Access here
-
Use the generated Python code to analyze your data and display graphs
The advantage of asking an LLM to generate code in Python is that you will be able to reuse it when you add new data to your coffee sales in subsequent months, ensuring a consistent analysis method.
Go further
If you need training or technical assistance to implement our solutions, contact your sales representative or click on this link to get a quote and ask our Professional Services experts for a custom analysis of your project.
Ask questions, give your feedback and interact directly with the team building the Data Platform on the dedicated Discord channel.
If you need support with your OVHcloud services, create a request in our Help Centre.
Join our community of users.
1: S3 is a trademark of Amazon Technologies, Inc. OVHcloud's service is not sponsored by, endorsed by, or otherwise affiliated with Amazon Technologies, Inc.