

Create and edit components
In this tutorial, you will learn how to create and edit your first charts, and add them to your dashboards
Objective
In this tutorial, you will learn how to create and edit your first charts, and add them to your dashboards.
Create and edit a chart component
Add a component
You can easily add a new component to your Rides Analytics dashboard.
To do so, append this json object to the array items in rides-analytics.json
This json defines a panel that contains 2 items, the chart itself and its title.
A chart is a special item that needs a request to work. Once the chart component is loaded, the request is performed and the result is displayed differently according to the chart's type.
The request has the same format as the Analytics Manager's queries. You can also create your request in the Analytics Manager and put the request id instead of the request itself. In this case, you will have to replace request by requestId in the json above.
The type of the chart is defined with the component key. There are many types of charts available natively in Data Platform, but you can also create your own components, we will show you how to achieve this in the next part of this guide.
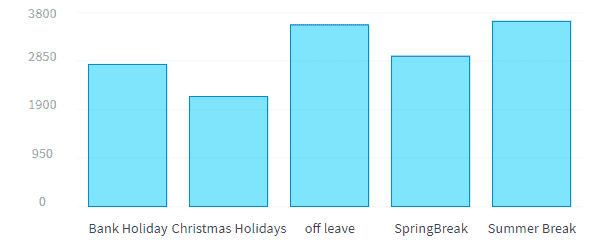
In this example, we've defined a new bar chart using the recharts library. The request computes the average number of rides per day for each holiday.
Initially, your chart looks like this:
Customize a chart
Since this chart is made with the recharts library, there are many properties that you can change.
The full list is available in Recharts Bar documentation page.
To pass these properties from your chart configuration json, you simply have to edit the options key relative to this chart.
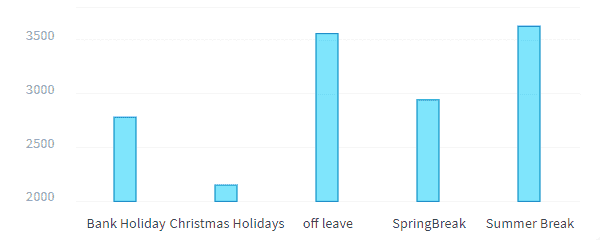
For example, to change the size of the bars, add a barSize property in the options as below:
You can also customize the axes by adding the xAxis or yAxis property. You can then pass the properties available in Recharts Axis documentation page
For example, change the domain and scale of your YAxis:
After these few changes, your chart looks now like this:
Let's backtrack a minute to the chart configuration file in order to explain the title configuration.
This component is also natively available with Data Platform. It allows you to write HTML code in the content property. It will be wrapped in a div. You can associate a custom class to this div by using the customclass property.
The html code associated to the json defined above is:
Learn more about custom charts in the Technical Guide!
Create and edit a dynamic parameter
A dynamic parameter allows the user to interact with one or more charts by changing their requests on the fly.
To create a new dynamic parameter, open config/menus/sidebar.json and add the following json object to the containers object, right above the footer item.
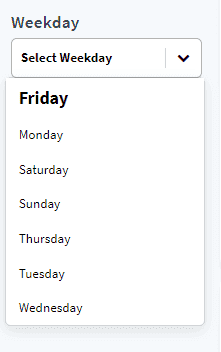
This json defines a dynamic parameter that allows you to filter chart requests by one or more week days.
It follows the same logic as the one followed by charts.
Here, we detail a bit this configuration:
type: indicates how the dynamic parameter will be used, as a filter in this case. It means that any chart associated with this dynamic parameter will see its results be filtered to display only those matching the selected weekdays.dictionary: sets the field linked to this dynamic-parameter.component: sets the component that this dynamic-parameter is associated with, in here, the selectbox component.id: serves to reference this object inside the platform and is commonly used to link this dynamic parameter to charts.placeholder: specific to the selectbox component, specifies the text displayed inside the selectbox by default.multi: specific to the selectbox component, it's a boolean property that allows selecting several options when set to true.
After copy-pasting the json object above defining this dynamic parameter, your new component should now appear in the sidebar:
To actually use this newly created dynamic-parameter, you have to link it to a chart. You can do this by editing the charts configuration.
- Open
config/dashboards/rides-analytics.json - In the json object defining the rides history chart, append
"dynamic-weekday"to the dynamic-parameters array. - Reload your page, your dynamic parameter is now linked to the rides history chart.
- Select a day to filter the chart by weekday and watch it refresh with new data.
Learn more about dynamic parameters in the Technical Guide!
You have learned how to use existing components. You are now ready to take on creating your own custom components and use them to make unique dynamic parameters and charts!
Go further
If you need training or technical assistance to implement our solutions, contact your sales representative or click on this link to get a quote and ask our Professional Services experts for a custom analysis of your project.
Ask questions, give your feedback and interact directly with the team building the Data Platform on the dedicated Discord channel.
If you need support with your OVHcloud services, create a request in our Help Centre.
Join our community of users.