

Build an IoT fleet-monitoring pipeline
This tutorial walks you through a complete, real-time pipeline on the Data Platform: streaming simulated IoT sensor telemetry from a Custom action into
Objective
This tutorial walks you through a complete, real-time pipeline on the Data Platform: streaming simulated IoT sensor telemetry from a Custom action into Apache Kafka, ingesting it into a Lakehouse Manager table, and visualizing fleet health on a live Superset dashboard.
By the end you will have a working dashboard that shows device health, environmental trends, anomalies, and downtime, driven by a scripted failure scenario so the data is always telling a story.
Introduction
Requirements
To follow this tutorial you need:
- An OVHcloud Data Platform project with Data Processing Engine, Lakehouse Manager, and a Superset/Trino setup available.
- An Apache Kafka broker you can write to. This tutorial uses an OVH managed Kafka service with client-certificate (mTLS) authentication, but the approach works with any broker once you adapt the connection settings.
- A Kafka topic named
iot_readingscreated on your broker (topic auto-creation is often disabled).
We recommend completing the first Getting Started tutorial and the Stream data from Apache Kafka tutorial first. This guide assumes you are comfortable with the main components of the platform.
What you will build
The scenario
The producer simulates a fleet of environmental sensors (temperature, humidity, CO₂, PM2.5) across four sites in three regions. A per-device state machine drives a realistic failure lifecycle so the data is never flat:
Two devices are scripted to fail on a fixed schedule, so every run reliably shows the full story. Readings follow a compressed ten-minute "daily cycle" with random noise, so trends look believable. When a device goes OFFLINE it stops emitting entirely, which shows up later as a genuine gap in the data.
About message format. The Kafka connector reads only root-level JSON fields, and it infers the table schema by sampling messages. Every message therefore emits every field with stable types (numerics are always floats, error_code is the string "NONE" when healthy). A field that is sometimes missing, or sometimes an integer and sometimes a float, would break the inferred schema.
Step 1: Store your Kafka credentials in a bucket
Rather than pasting certificates or passwords into the action source, store them in a Lakehouse Manager bucket and pull them at runtime. A Custom action is self-authenticated to its project, so it can read the bucket without any extra credentials, and nothing sensitive lives in your code.
- In Lakehouse Manager, create a bucket named
iot-demo-certs. - Upload your three mTLS files into it:
The producer downloads these at startup using the bucket connector in the SDK.
Never commit certificate or key files to a repository, and never paste them into the action source. Keep them in the bucket only.
Step 2: Create the producer Custom action
Download the producer and add it as a Custom action:
- Go to Data Processing Engine > Actions > New > Custom.
- Upload the downloaded
producer.pydirectly. - Set the entry function to
customfuncin the action's Information panel. - Add
kafka-pythonto the action's Python Requirements. - Set the execution mode to Always-up. The producer loops continuously, so Serverless mode would time out.
Use kafka-python, not kafka. The bare kafka package on PyPI is an abandoned Python-2-only distribution and fails on the workers with invalid syntax (simple.py, line 54). The kafka-python package is what provides the from kafka import ... namespace.
Parameters you can adjust
All configuration lives at the top of the file. The ones you are most likely to change:
Code highlights
You do not need to read the whole file to run it, but a few parts are worth knowing.
Connection block. Set your broker endpoint and auth method here, and choose whether the run is finite:
Credentials from a bucket. The certificates are pulled at runtime, never hard-coded, so nothing sensitive lives in the action:
The fleet. Change the sites or the per-site count to resize the simulation:
The failure scenario. Two devices fail on a fixed schedule, and these durations set the pace of the OK to DEGRADED to FAULT to OFFLINE story:
Run the action. Every message carries all twelve fields with stable types, so the schema is complete as soon as any data flows. The first scripted device degrades after about fifteen seconds, so DEGRADED and FAULT samples appear quickly. Watch the action logs for the heartbeat line: sent ~N messages; fleet: {...}.
Step 3: Connect Kafka with the source connector
Go to Connectors > Sources > Apache Kafka and create a connection. Point it at your broker endpoint and the iot_readings topic.
For an mTLS broker, authenticate with the connector's SSL fields: upload your CA certificate, client certificate, and client key, and leave username and password blank.
The connector form exposes SSL fields even when the broker uses client certificates. Those are what make the mTLS handshake work. For full details see the Kafka connector reference.
Step 4: Extract metadata and create the table
Once data is flowing, open the Analyzer and extract the metadata.
You will see sixteen attributes: the twelve fields from the producer, plus four envelope columns added by Kafka (timestamp, date, offset_r, partition). For a simple append-only table you can skip all four envelope columns. Keep partition and offset_r only if you want upsert or deduplication semantics.
The producer emits ts as an ISO-8601 string. If it is inferred as a string, you can either set it to a Timestamp type in the table, or keep it as a string and parse it in Trino (see Good to know). Build the Lakehouse Manager table iot_readings from the resulting schema.
The complete column list:
OFFLINE never appears as a row value. An offline device stops emitting, so downtime shows up as a gap (no rows for that device_id). You detect it by comparing each device's latest ts against the current time.
Step 5: Load the stream into your table
Create a Load action in Data Processing Engine, mapping the iot_readings topic to your iot_readings table. Run it in Always-up mode so it keeps consuming the live stream.
The Load action keeps running as long as data exists in Kafka, up to its timeout. That is expected for a streaming load.
A Load action that completes normally runs a metadata update automatically, so the table's row count refreshes on its own. In this streaming setup the action runs Always-up and is stopped manually or times out rather than ending cleanly, so that automatic update may not run. When that happens, run an Update Metadata action so the row count in Lakehouse Manager reflects the data that was ingested.
Step 6: Query the table from Superset
Connect Superset to your table through Trino. If you have not deployed Superset yet, follow Deploy Apache Superset.
In Superset, add a database connection with a SQLAlchemy URI of the form trino://<user>@<trino-host>:<port>/<catalog>. Test the connection before building charts. This is the step where end-to-end setups most often break.
If ts arrived as a string, parse it in Trino with from_iso8601_timestamp(ts), which returns a TIMESTAMP(3) WITH TIME ZONE. Create a virtual dataset that exposes the parsed column and mark it as the dataset's main temporal column, so it becomes available as the X-axis of time-series charts.
Step 7: Build the dashboards
The finished dashboard is a single-screen view of the whole fleet.
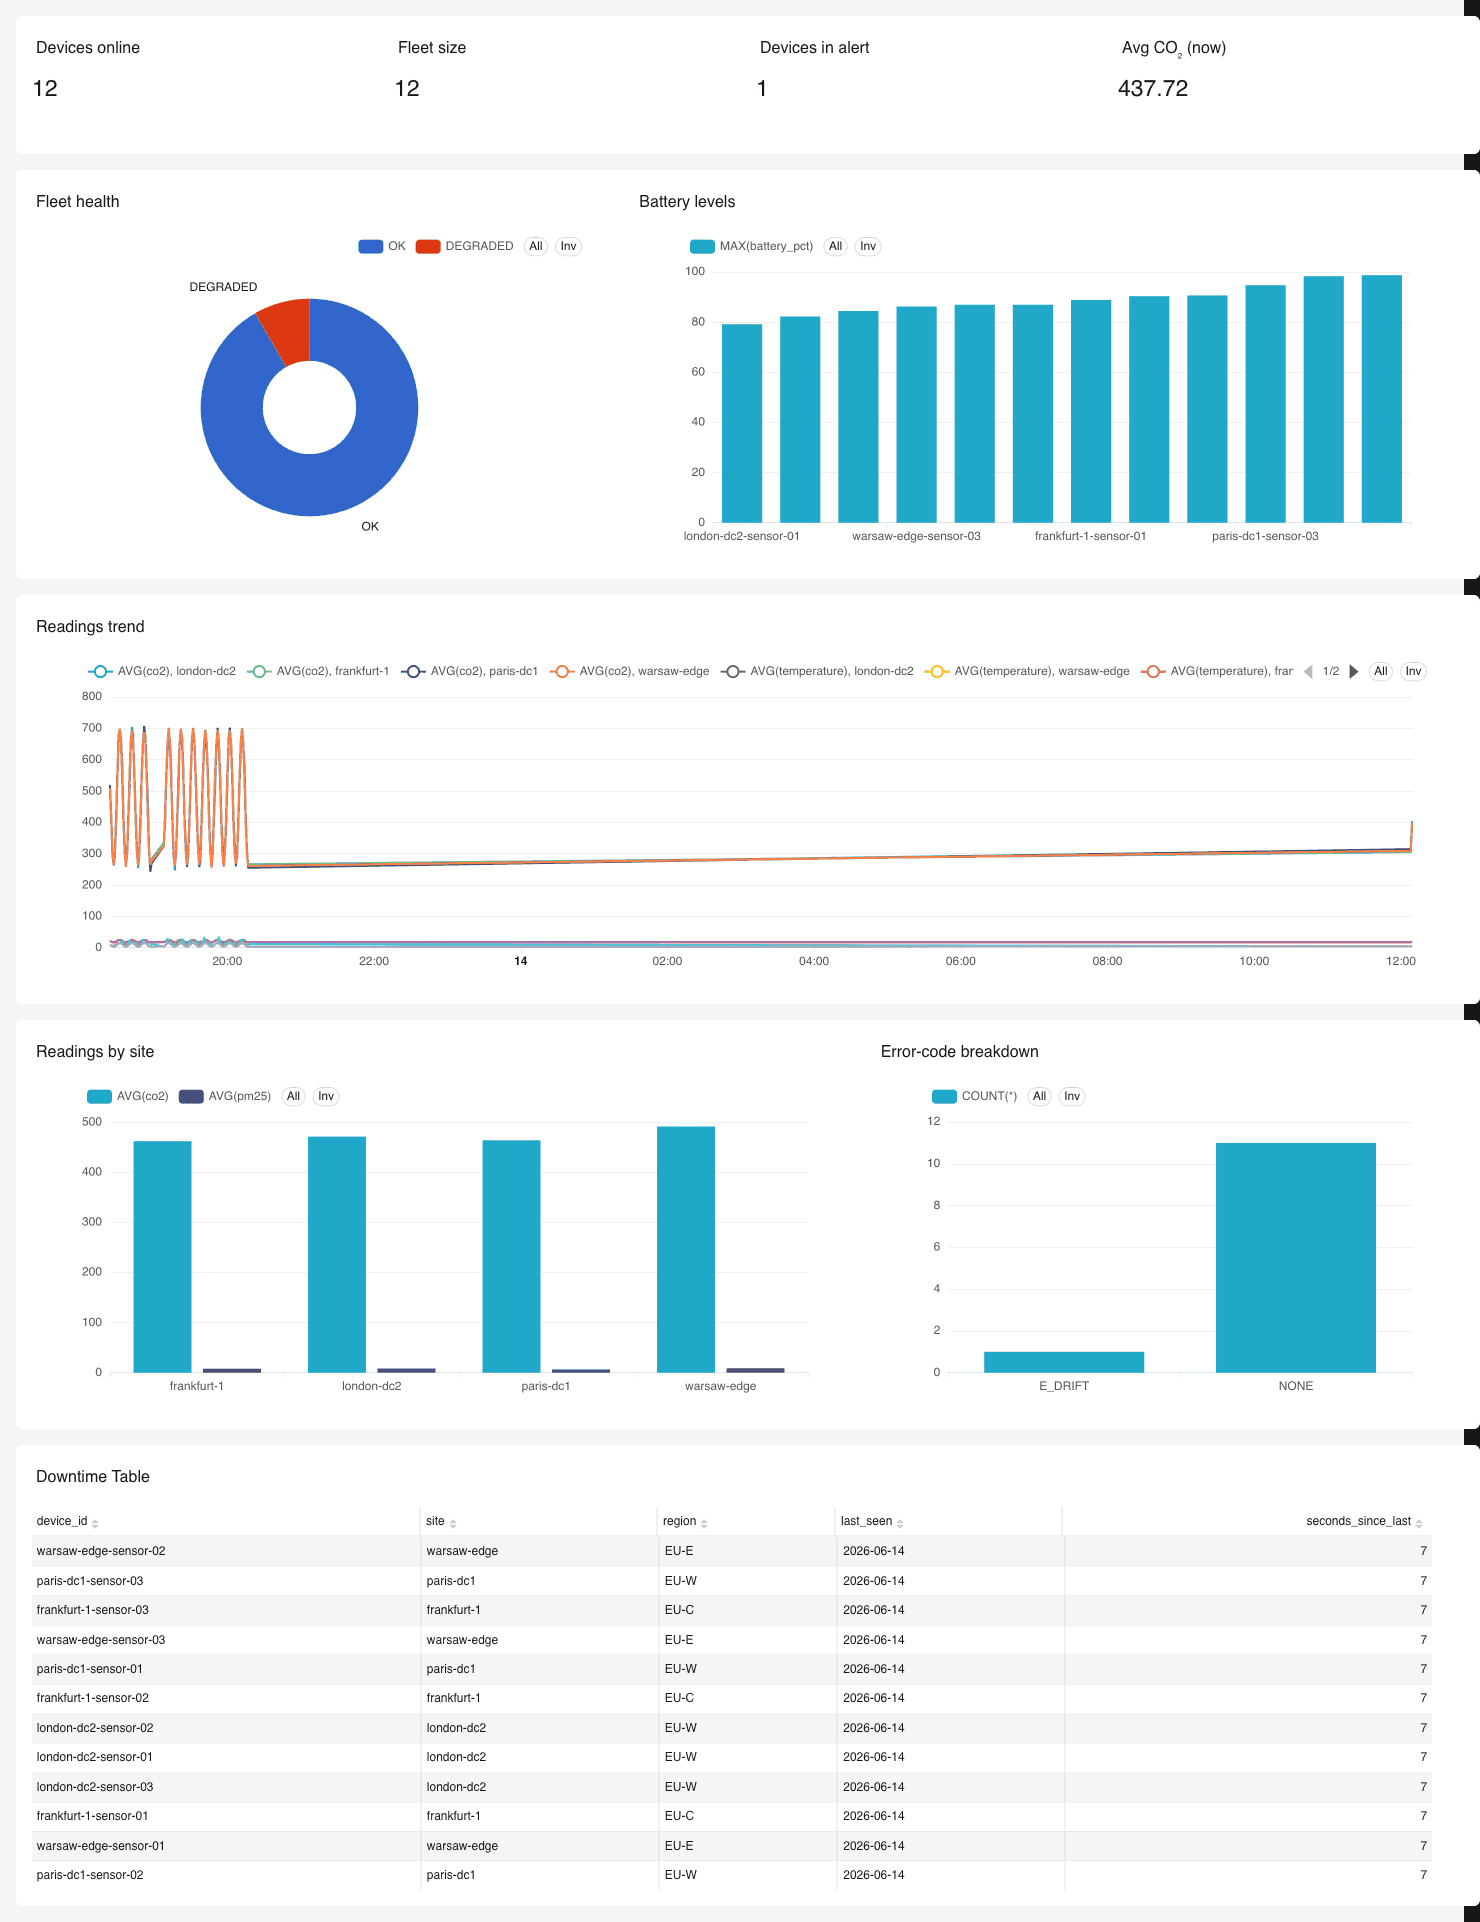
A practical set of panels:
For the full virtual datasets and the exact Trino SQL and configuration of every panel, follow the companion page:
A few Superset tips that save time:
- On bar charts, put the category in the X-axis and leave the Dimensions box empty. Dimensions is only for splitting each bar into sub-series.
- Threshold lines, such as a battery warning level, are available on time-series charts through annotation layers. On a categorical bar chart, sort ascending instead. On a table, use conditional formatting.
- CO₂ values (around 480) dwarf temperature (around 21) and PM2.5 (around 9) on a shared axis. Chart CO₂ separately, or use a secondary axis, so the small metrics stay readable.
- The downtime table is empty when the fleet is healthy, which is correct. Build it without a filter so it lists every device, then highlight stale rows with conditional formatting, so the panel never looks broken.
Good to know
- The producer never ends by design. It is an infinite loop in Always-up mode. The action's default timeout is around two hours. If you stop it manually it shows as "stopped" rather than a success, because there is no natural end. To get a clean success run, set
MAX_RUNTIME_SECSto a number of seconds. The loop then flushes, closes, logs a total, and exits. Leave it asNonefor a continuously live dashboard. - Refresh the row count with Update Metadata. A Load action that ends normally updates the table metadata automatically. In this streaming setup the action runs Always-up and is stopped or times out instead of ending cleanly, so as noted in Step 5 you may need to run an Update Metadata action for the row count to reflect what was ingested.
- Parse
tsfor time-series. If the column is a string, parse it withfrom_iso8601_timestamp(ts)and mark it as the temporal column in Superset. - Guard against unparseable rows. If a test message left a row whose
tsis not a valid timestamp,from_iso8601_timestampthrowsINVALID_FUNCTION_ARGUMENT. Wrap the parse intry(from_iso8601_timestamp(ts))so the bad row resolves to null, or delete the row.
What you have built
You now have a full streaming pipeline: a Custom action producing simulated telemetry, Kafka transporting it, a connector and Load action ingesting it into Lakehouse Manager, and Superset visualizing it live over Trino. As the scripted failures play out, the dashboard moves through the whole story: a healthy fleet, a device degrading and faulting, a window of downtime that surfaces in the downtime table and as a gap in the trend, and finally a repair that returns the device to normal.
From here you can extend the model with a separate device dimension table, add more metrics, or adapt the producer to replay your own real sensor data.
This pattern scales. The same building blocks compose into a much larger pipeline. Because one topic maps to one table, you handle multiple data streams by repeating the pieces: add more Kafka topics, extract metadata for each into its own Lakehouse Manager table, and run one Load action per topic-to-table mapping. A single producer can emit to several topics, and Superset can join across the resulting tables through Trino. So a multi-topic, multi-table fleet (for example, separate streams for environmental readings, energy usage, and device events) is just this tutorial applied several times over, feeding one set of dashboards.
Go further
If you need training or technical assistance to implement our solutions, contact your sales representative or click on this link to get a quote and ask our Professional Services experts for a custom analysis of your project.
Ask questions, give your feedback and interact directly with the team building the Data Platform on the dedicated Discord channel.
If you need support with your OVHcloud services, create a request in our Help Centre.
Join our community of users.