

Discover the app configuration files
Understand and edit the configuration files of a Data Platform application, from the global config to a dashboard
Objective
This guide covers the configuration files of a Data Platform application: what each directory holds, then how to edit the global configuration, an API attribute, the sidebar's date-picker and a dashboard.
Understand the app files
Understand the app architecture
You have now a complete application. Your app tree should look like this:
Let's clarify the content of each directory:
config: Here is where most of magic happens. In this folder, you can define and update your configuration files for dashboards, menus, styles, translations etc... The most important file here isglobal.json, it allows you to declare and use all of these configuration files. (explained right after)forepaas: This is the equivalent ofnode_modulesfor the platform. It contains all the basic components needed to embed your application to Data Platform. All the packages listed in /forepaas.json are installed here.node_modules: The node_modules folder contains libraries downloaded from npm. It is based on /package.json.public: This folder contains all the static files (fonts, icons, images...). You can access a file stored in this folder through this url/assets/{subfolder}/{name}.{extension}.
For example, the url to accessfavicon.png(and display it in a<img>tag) located inassets/imgis `/assets/img/favicon.pngscripts: This folder contains some useful scripts that you can use to generate components, dashboards or zip this Project to upload it easily on the platform.src: In this folder, you can create or update your own custom components and services. We will teach you how to do it in the next steps of this tutorial.
Understand the configuration files
The global configuration file is global.json.
This file represents the entry point of your application.
It is where you declare your environment variables, routes, dashboards, and many more important fields.
Open global.json located in the config folder.
Initially, it looks like this:
Let's explain the most important fields below :
-
authentication: refers to the authentication url, it should have this shape:https://{api-subdomain}.eu.dataplatform.ovh.net/cam?app_id={app_id}.
By default it is defined as an environment variable. It is important to keep it this way to deploy your app on production. Please refer to this part to understand how to overwrite this field for local development purposes. -
api: Same as above, but, refers to the api URL, it should have this shape:https://{api-subdomain}.eu.dataplatform.ovh.net/{api-alias}. -
application_name: Your application title -
root: The root path of your application. -
menu: An array containing your menus configuration files.
The header and the sidebar are already defined by default. -
dashboarding: An object to define your dashboards. The attribute is the dashboard url, and the value is the dashboard configuration file. -
style: The style configuration file. It allows you to style the components. Some components are already styled there. -
i18n: An object to define all your supported languages. The attribute is the language alias, and the value is the translation configuration file associated to the language. -
formatter: The formatter configuration file. It allows you to format the data, round numbers, add units, etc...
Some fields are already formatted by default.
Edit the configuration files
Now that you are more familiar with app architecture, you can finally edit the app!
Overwrite the global configuration file
The first step is to link your local application to the authentication service and to the API created previously on your Project.
Since we only need these changes to happen locally, we don't want to directly edit global.json. We will create another file global-override.json to override it instead.
- Create
global-override.jsonin theconfigfolder - Copy and paste this json into your new file:
There are three variables that you need to replace:
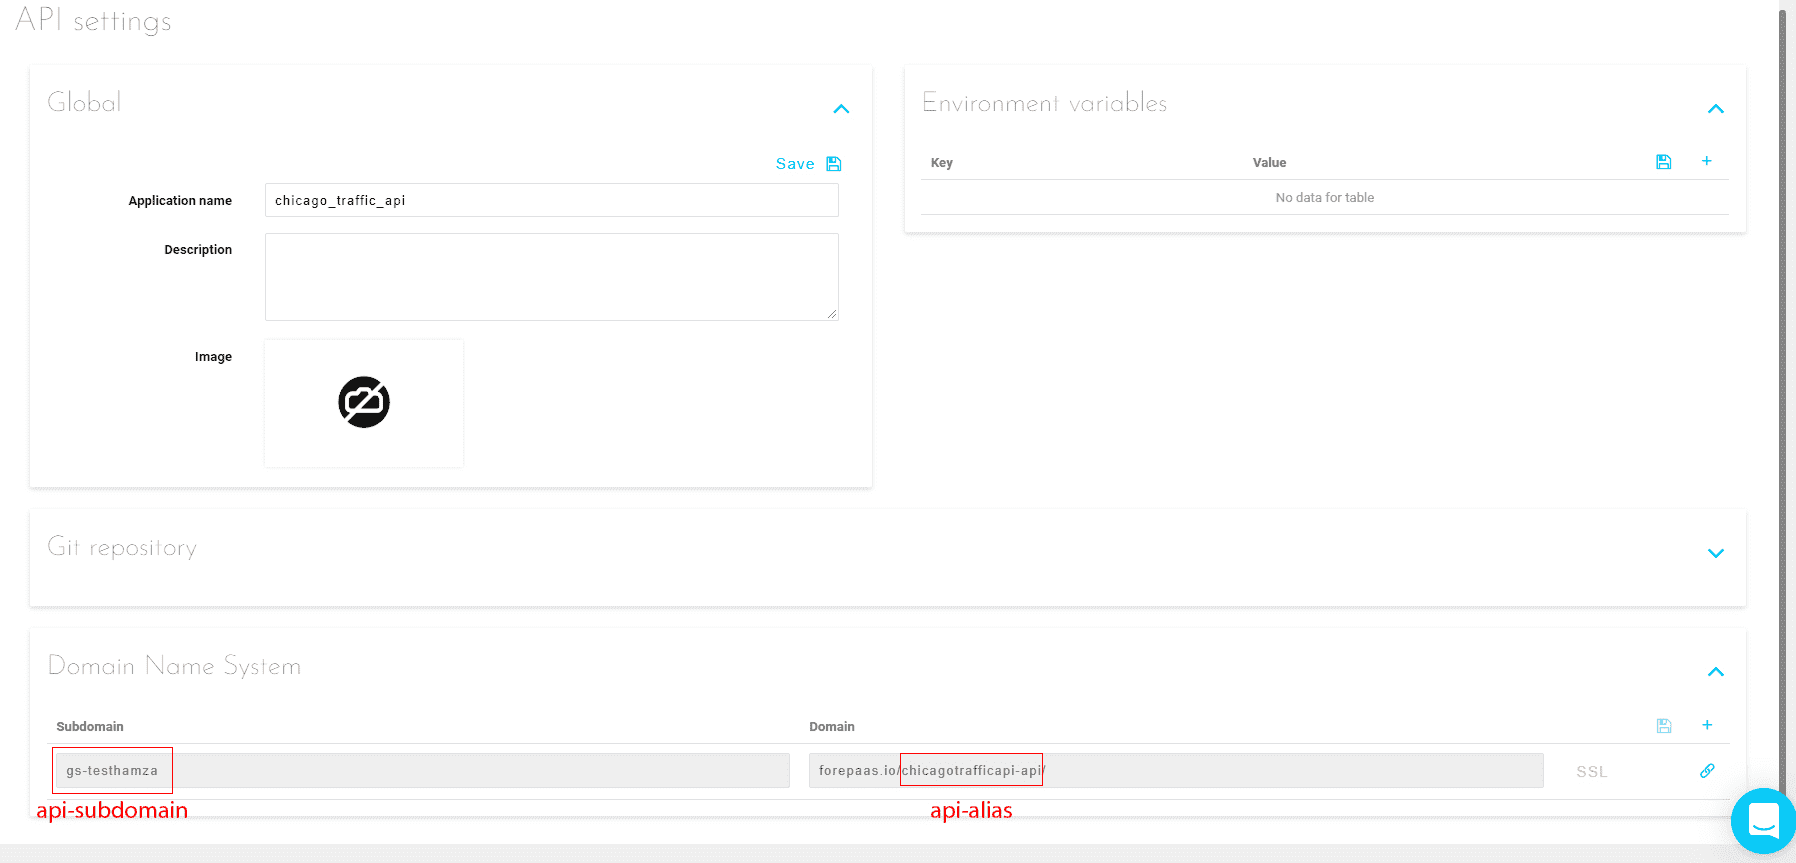
{api-subdomain}: Log into the platform, go to your API settings, this variable is referred to as the "Subdomain" in the Domain Name System panel{api-alias}: This variable can be extracted from the "Domain" by removingeu.dataplatform.ovh.net/
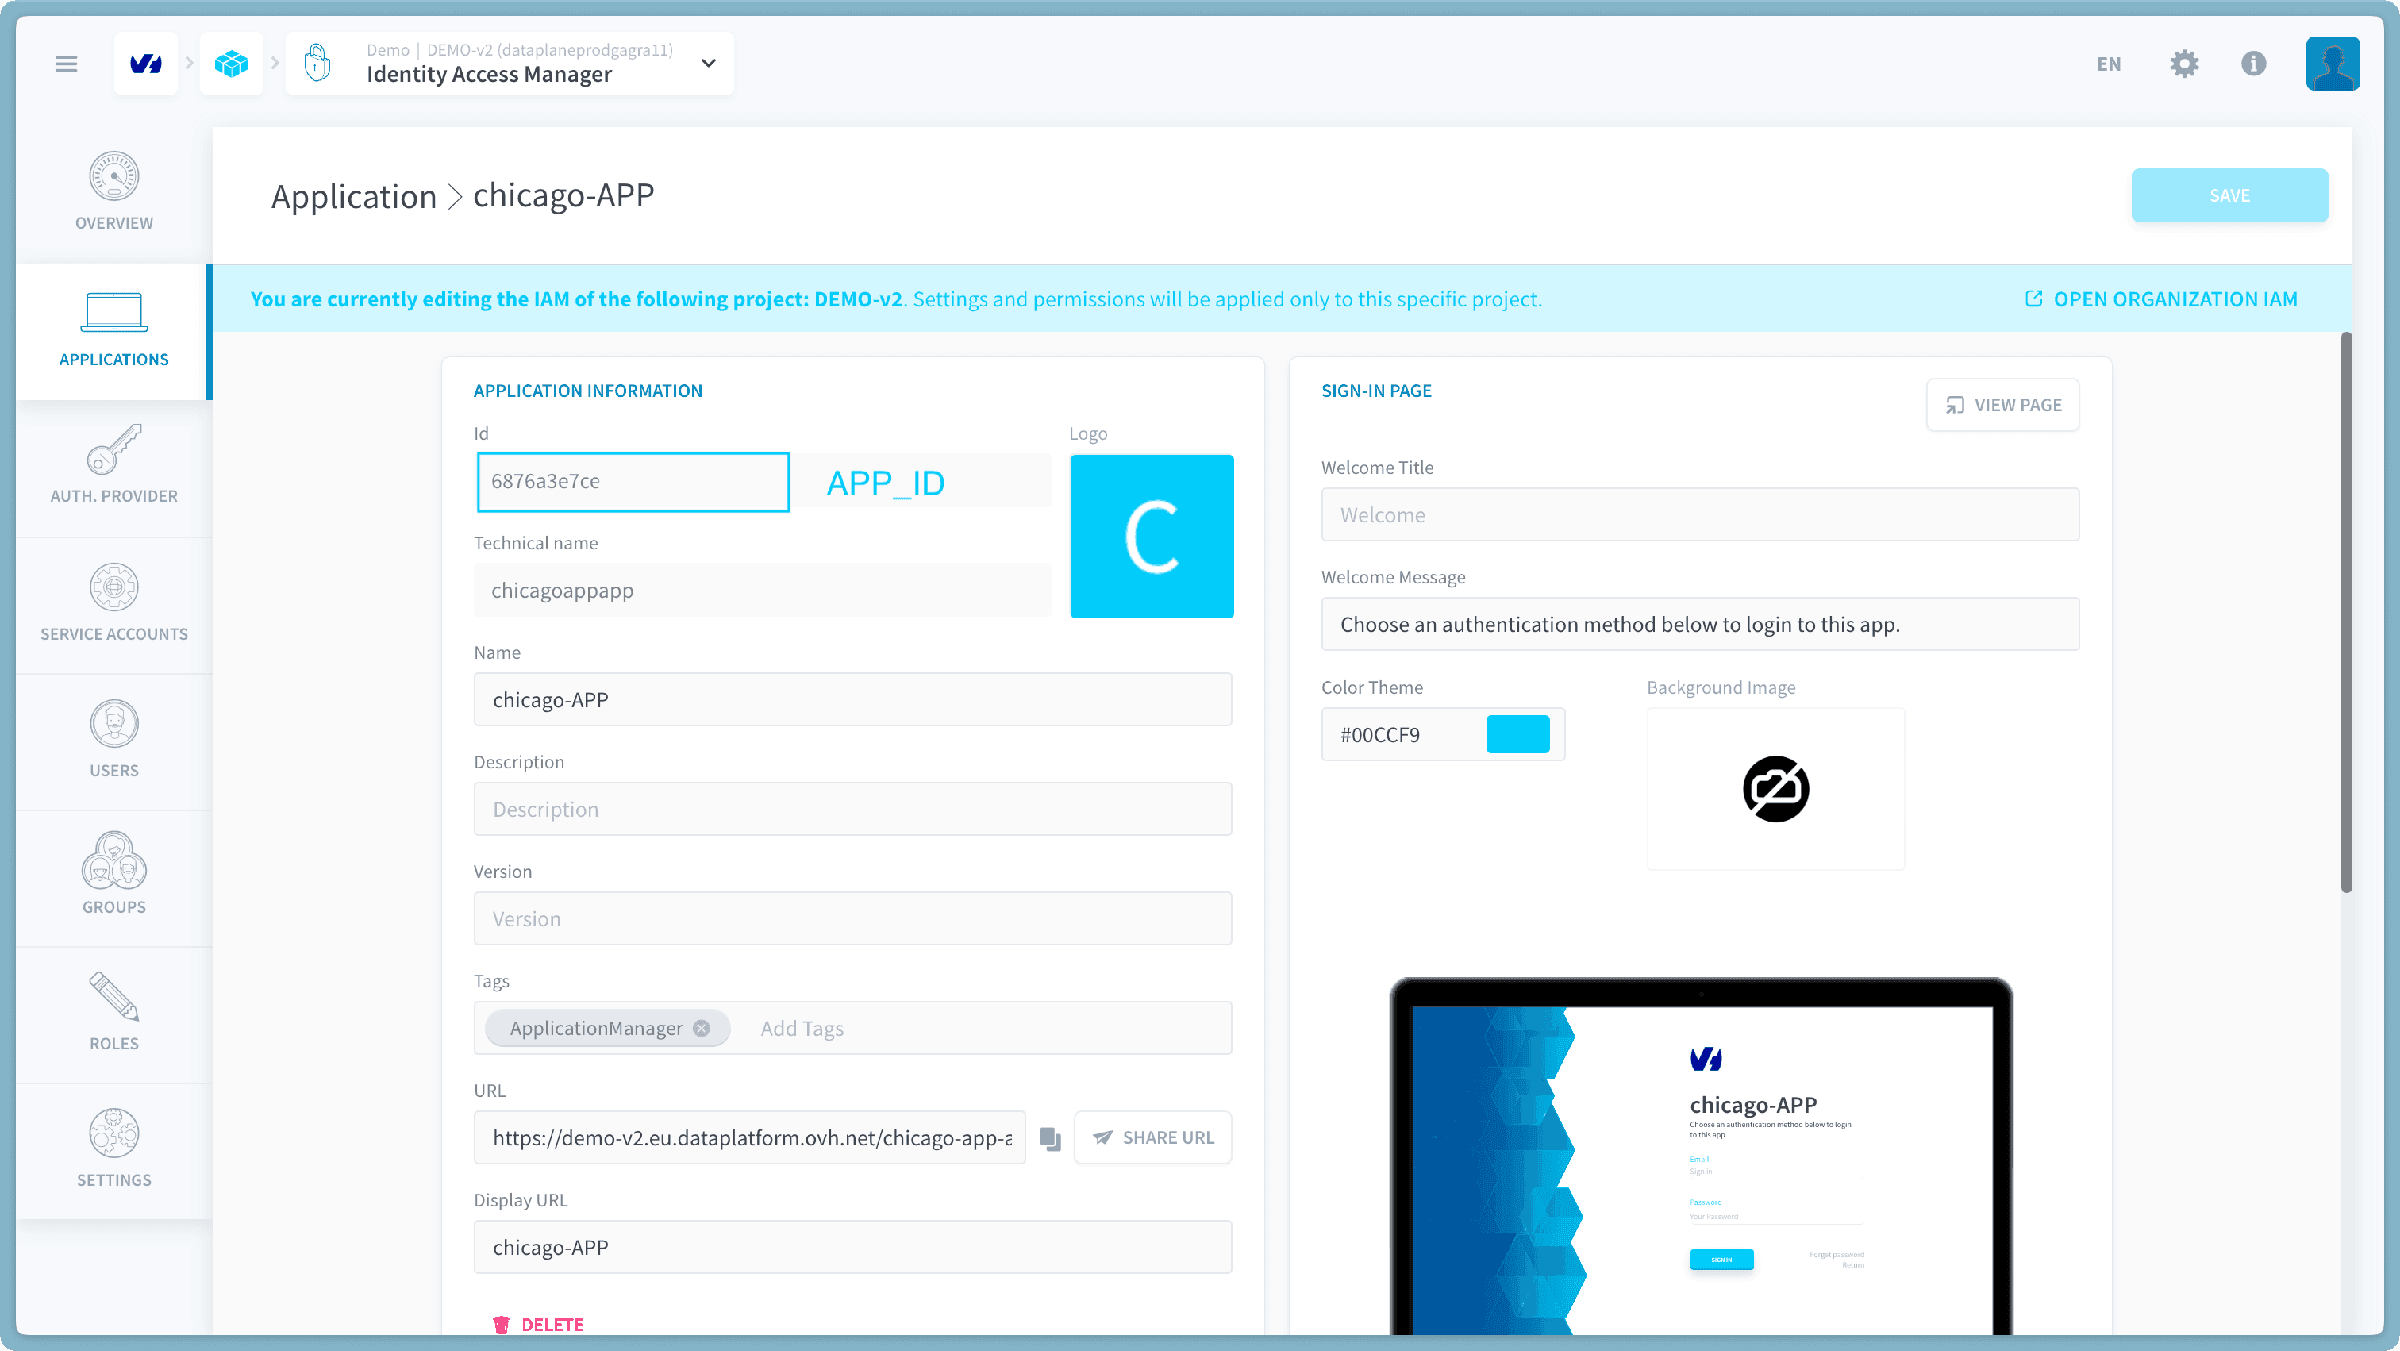
app_id: Go to the Identity Access Manager page. In the Application tab, go to edit your app. This variable is referred to as "Id" in the application information.
Remember that it is necessary to modify authentication privileges to allow to fetch your online data from your local build. Do it by adding your local host (http://localhost:3333 by default) to the CORS origin in Identity Access Manager > Settings > CORS origin > Add.
Save all files. The locally running app now displays a bit more of an advanced view of what you had at the end of the Getting Started guide. 🤓
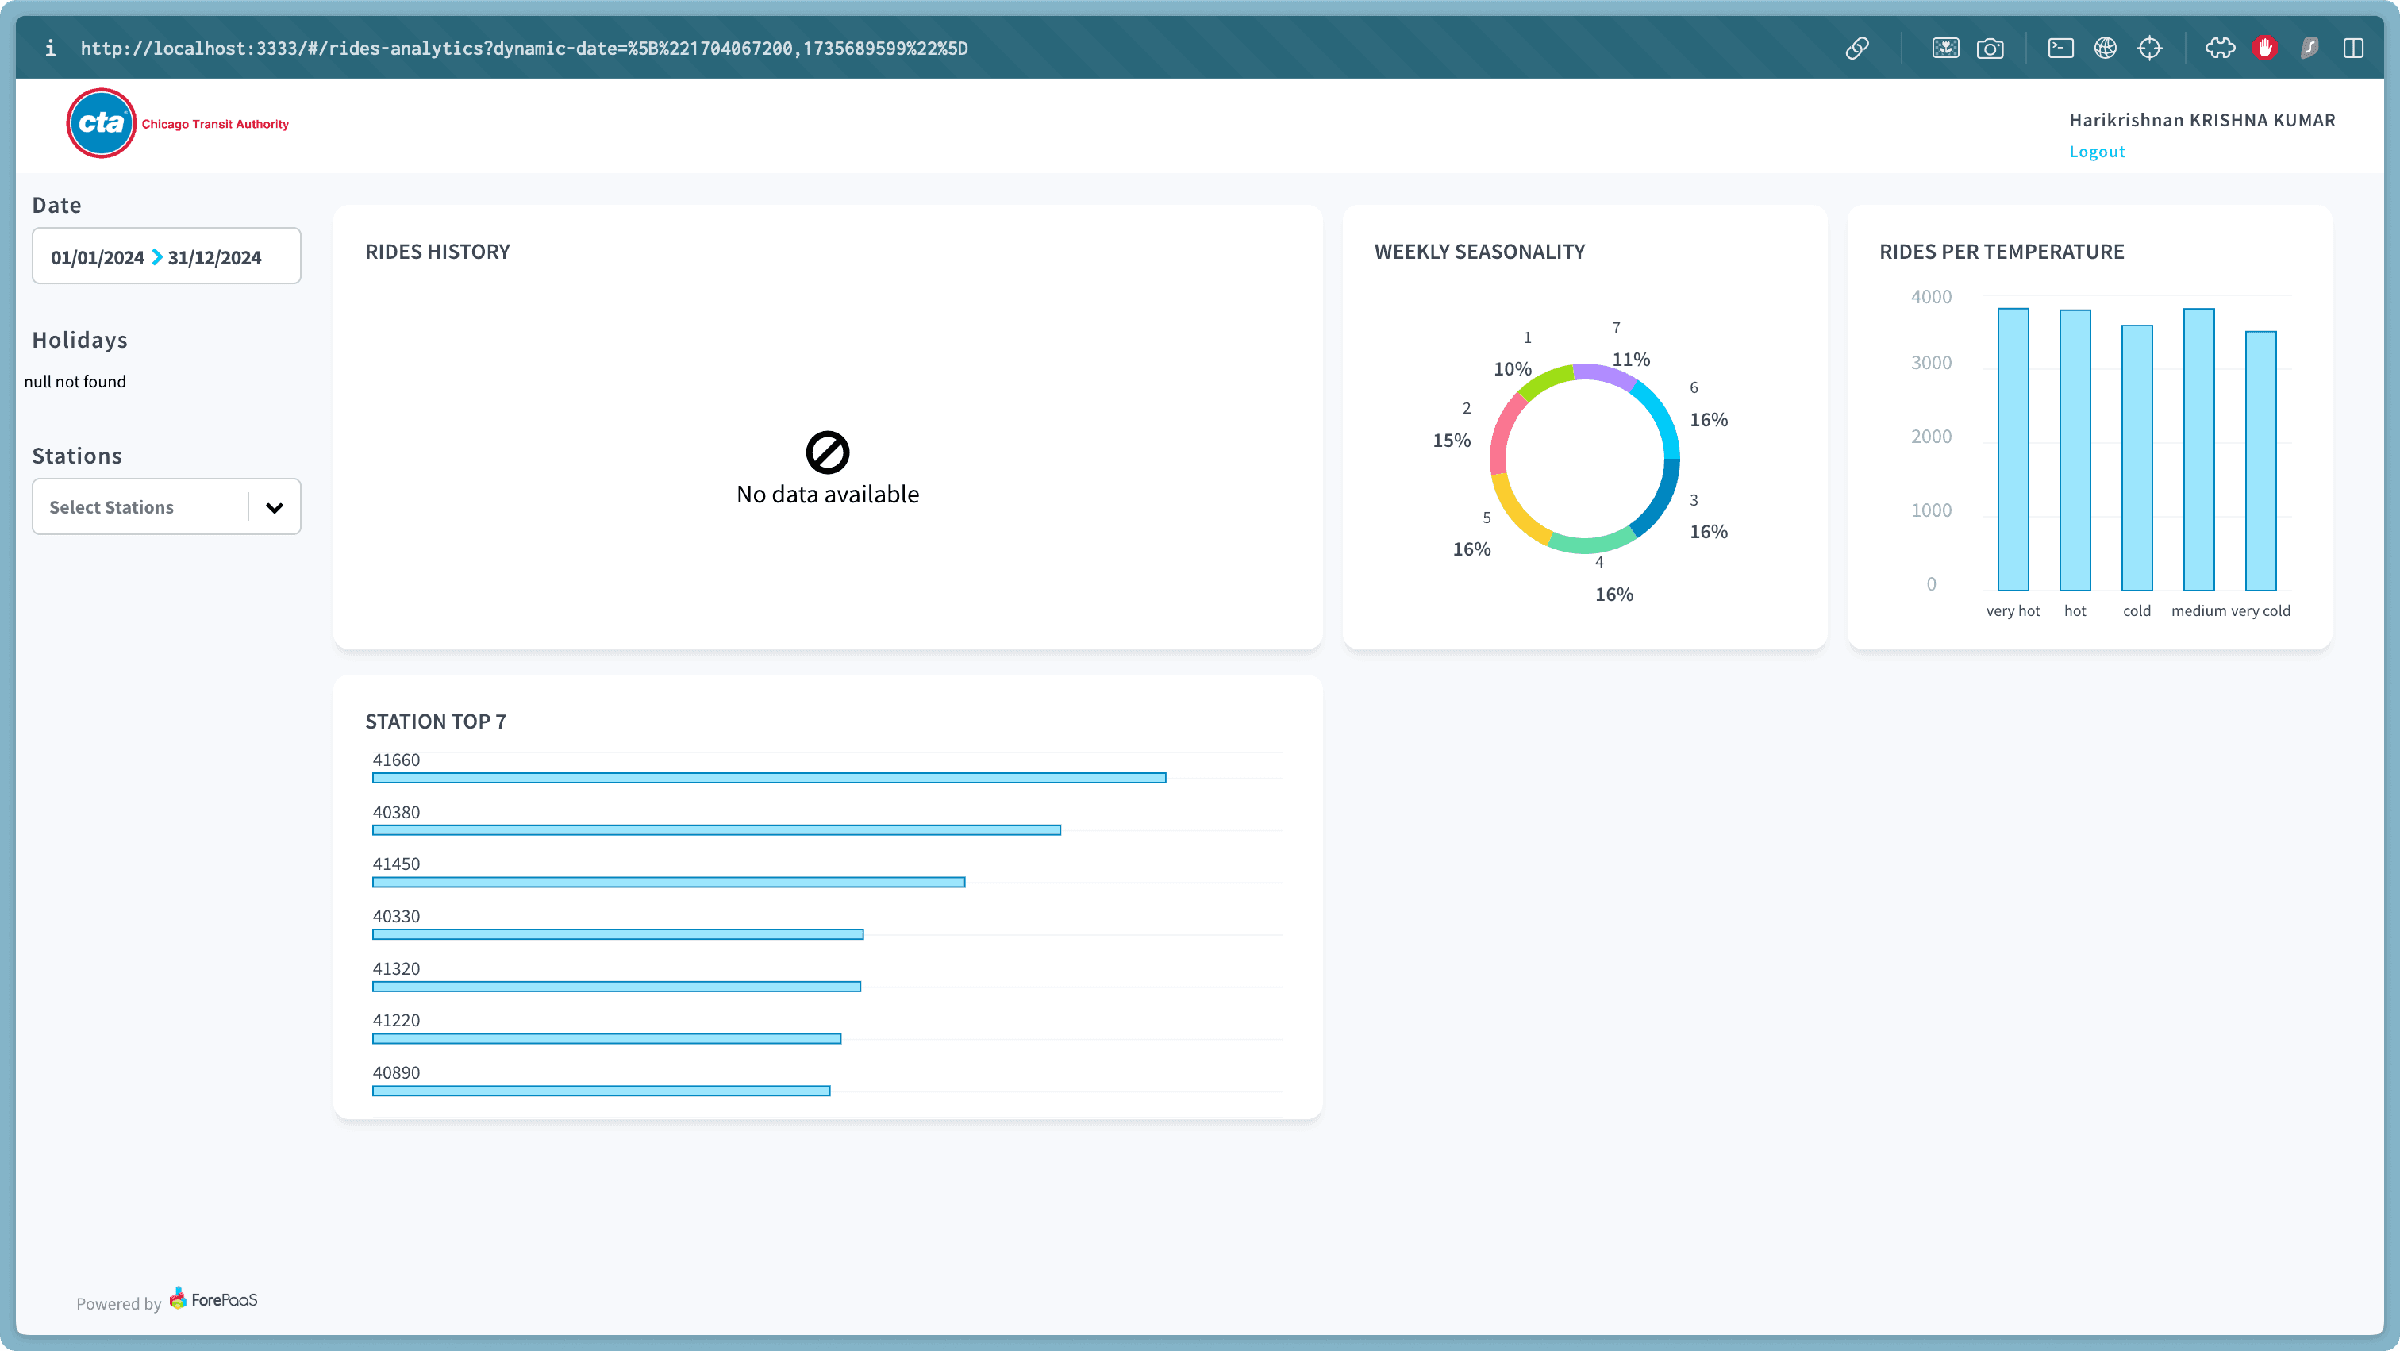
The following image shows how it will look on the first start after configuring the global-override.json but as you can see there seems to be an issue with the holiday select box and the rides history data display. The following section explains how to resolve these problems.
Add the cat_holiday attribute to your API
You may notice that in the sidebar the holidays selector isn't displayed correctly. That is the case because you have no exposed attribute related to holidays as part of the getting-started guide.
In the app template provided to you, that attribute is named cat_holiday. We encourage you to try to understand why this problem appears by looking into the sidebar.json file for mentions of the dictionary name.
To address this, you have to:
- Add a string attribute named cat_holiday to the table dataset_history.
- Build the dataset_history table and generate the respective DPE Action again.
- In the DPE, change the table's Aggregate Action to correct create the cat_holiday attribute with the code below.
- Run the respective workflow again.
- Flush the cache in Application Services.
Now, just rerun your app and the Holidays Selector should be looking good.
Edit the range of the date-picker in sidebar.json
The reason the rides-history chart shows "no data" is that the date-picker is not set to match the dataset’s actual range. Currently, the sidebar’s date-picker only displays a date range from today to one year ago because of its configuration. Since our Chicago files dataset covers the years 2015 to 2020, we need to update the sidebar.json file by modifying specific fields to ensure the date-picker includes the full range of our data.
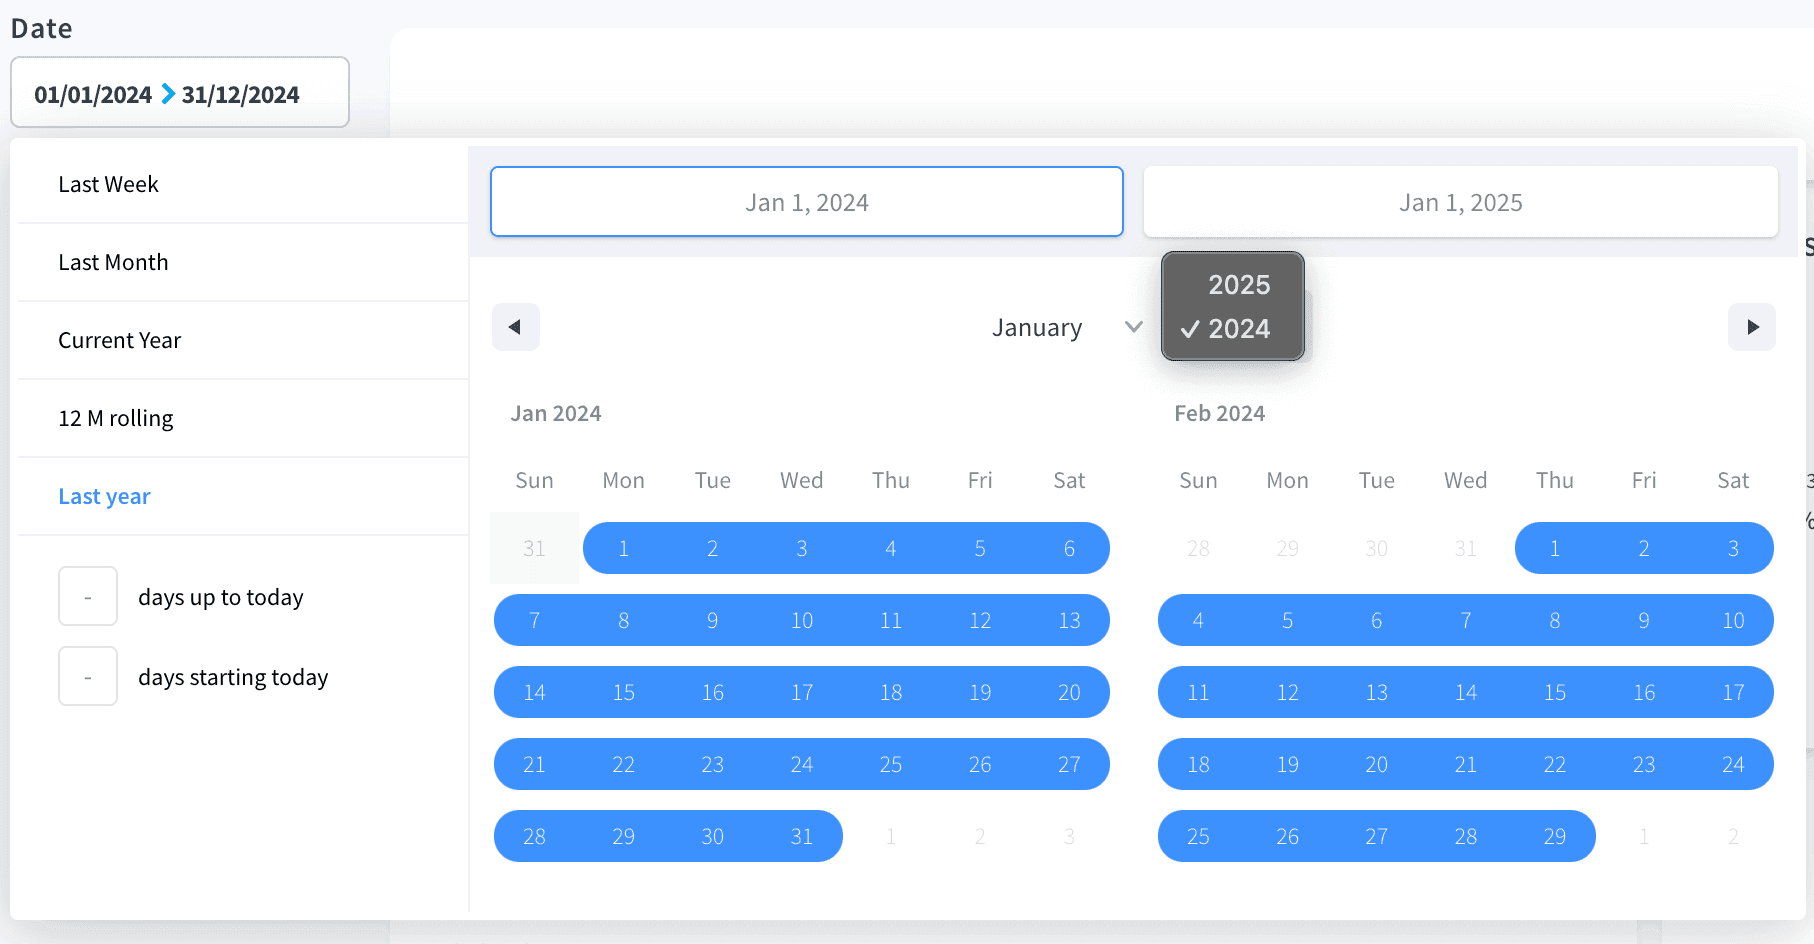
To address this, you have to:
- go to
sidebar.json - find the fields for startAt, minDate, maxDate, endAt.
- replace the above section with the code below.
Now, just save and rerun your app and the data-picker should be having the range between 2015 and 2020.
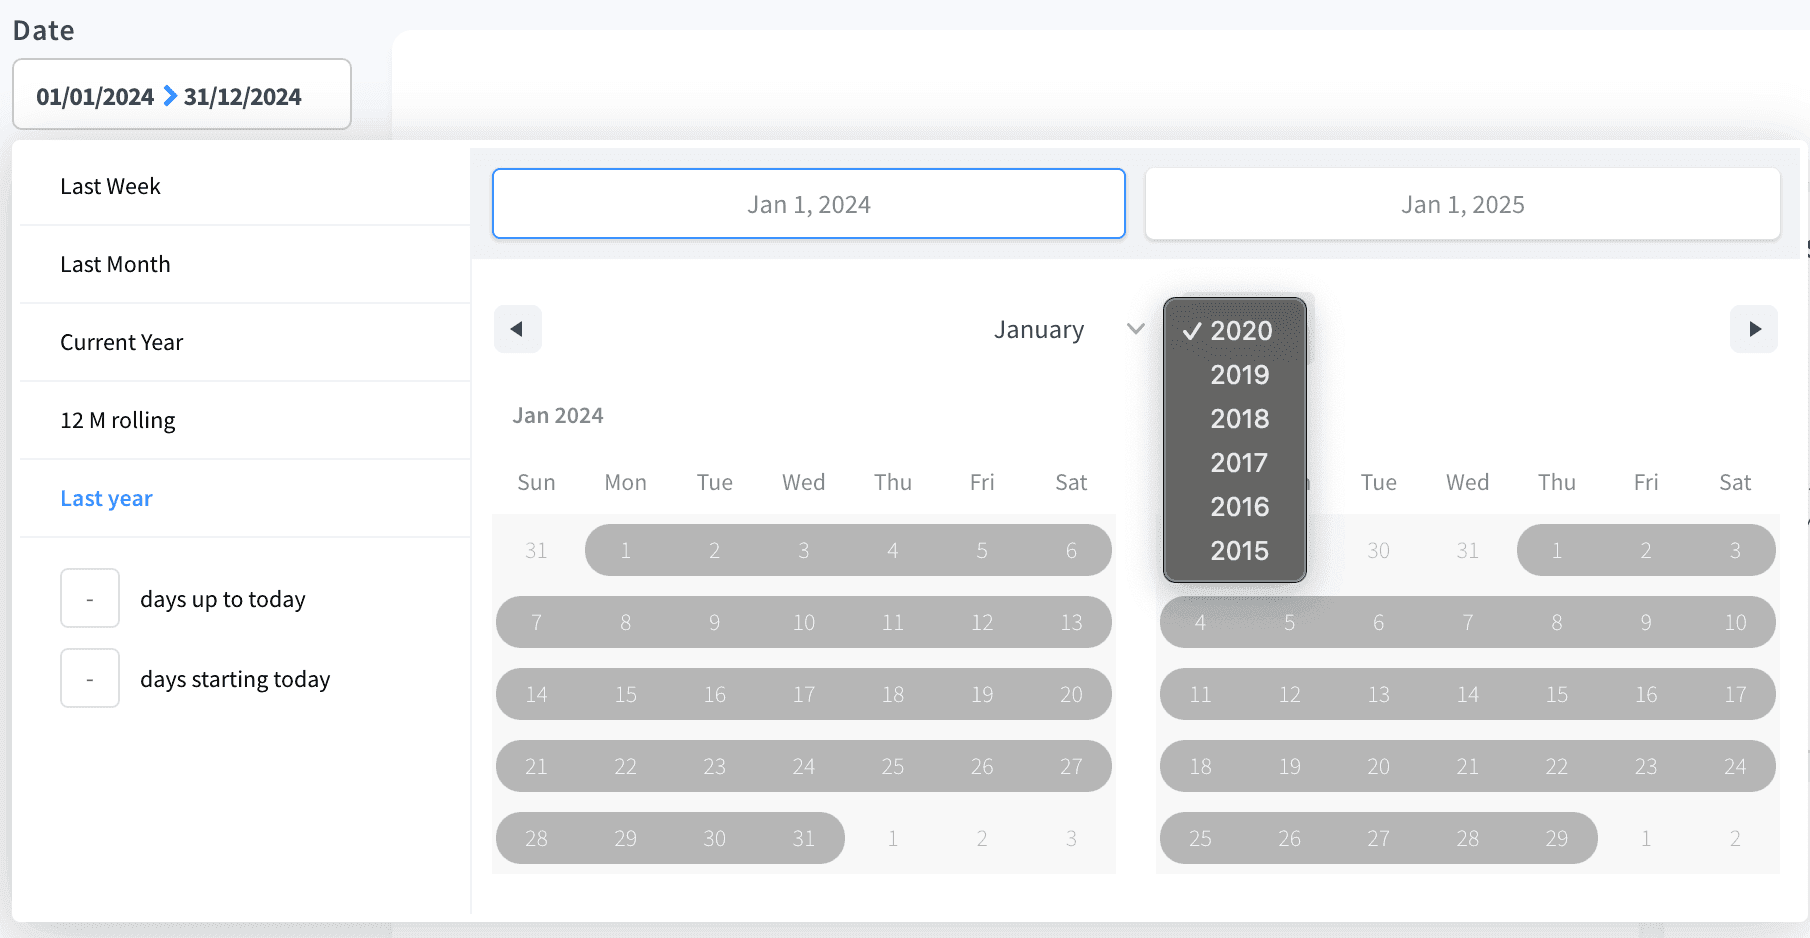
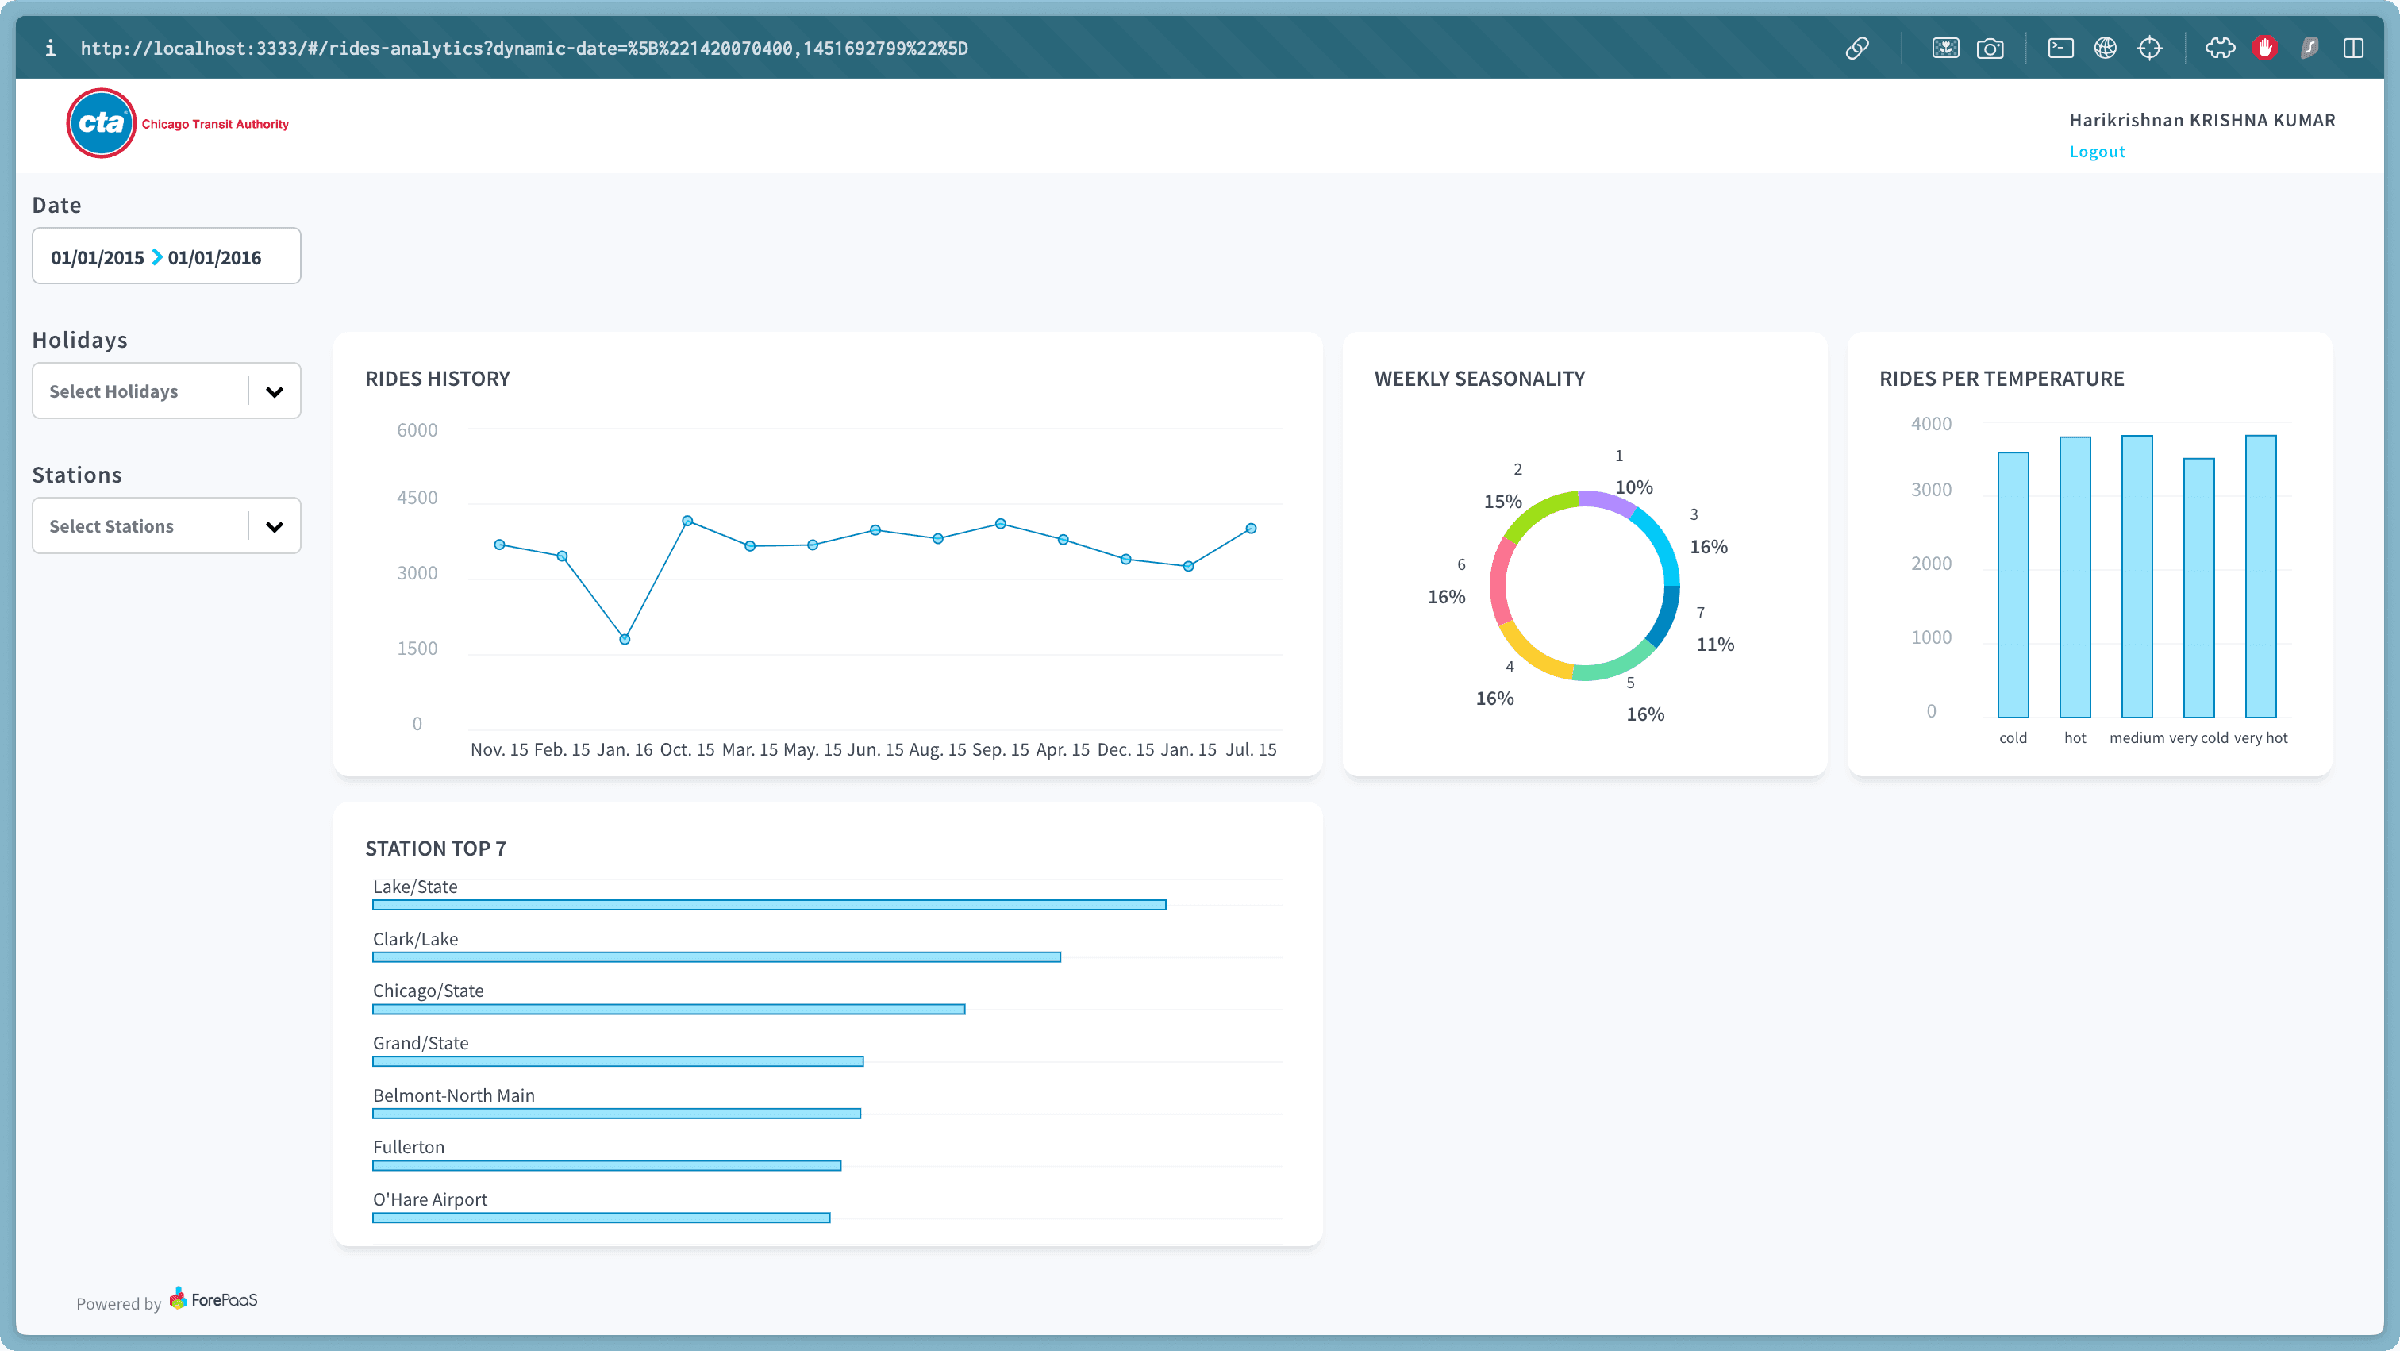
Now that the date picker is fixed, let's test it out! Select a range, for example, from January 1st, 2015, to January 1st, 2016.
You should now see the rides-history chart populate with data. If the chart looks scattered or incorrect, it's probably because the data isn't ordered by date. To sort this, open rides-analytics.json and add the following snippet to the rides-history request definition:
Change the attribute used for stations picker in the sidebar
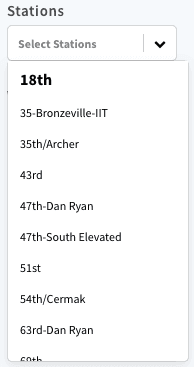
Currently, when you interact with the 'Stations' selector in the sidebar, you'll see a list of raw station IDs. While these are technically correct, they don't offer much in terms of user-friendliness! Let's enhance this by displaying the actual station names instead, making the selection process much clearer.
To achieve this:
- Navigate to the
sidebar.jsonconfiguration file. - Locate the component definition that has the ID
dyn-stations. - Update the attribute property within this component's dictionary to station_name. This tells the component to fetch and display the human-readable names from your dataset.
- Next, you might observe that the Top 7 Stations chart is currently displaying
station_idvalues instead of more readable station names. To correct this, apply a similar change to the one you made earlier:- open your
rides-analytics.jsonfile and locate the configuration for the 'Top 7 Stations' chart. - Then, update its relevant field scale to use
station_name.
- open your
Edit a dashboard
As you saw in global.json, your application already has a dashboard called rides-analytics.
In this part, you will see how to edit the dashboard configuration file to change the layout and the positions of the elements.
Let's start by opening rides-analytics.json in config/dashboards.
You will first create a panel and control the height, the width and the position of an item.
To create a panel, append these few lines to the end of the array items
It will be a placeholder for your future search bar, so let's make search-bar its id.
- type: Represents the item's type. It can be a component provided by the Platform by default or a specific component.
- id: The id of your item.
- size X: Represents the width of the item. The value must be between 0 and 100 as it represents a percentage of the containing item's width.
- size Y: Represents the height of the item.
- row: Represents the row offset.
- col: Represents the column offset.
After adding the panel, the application looks like this:
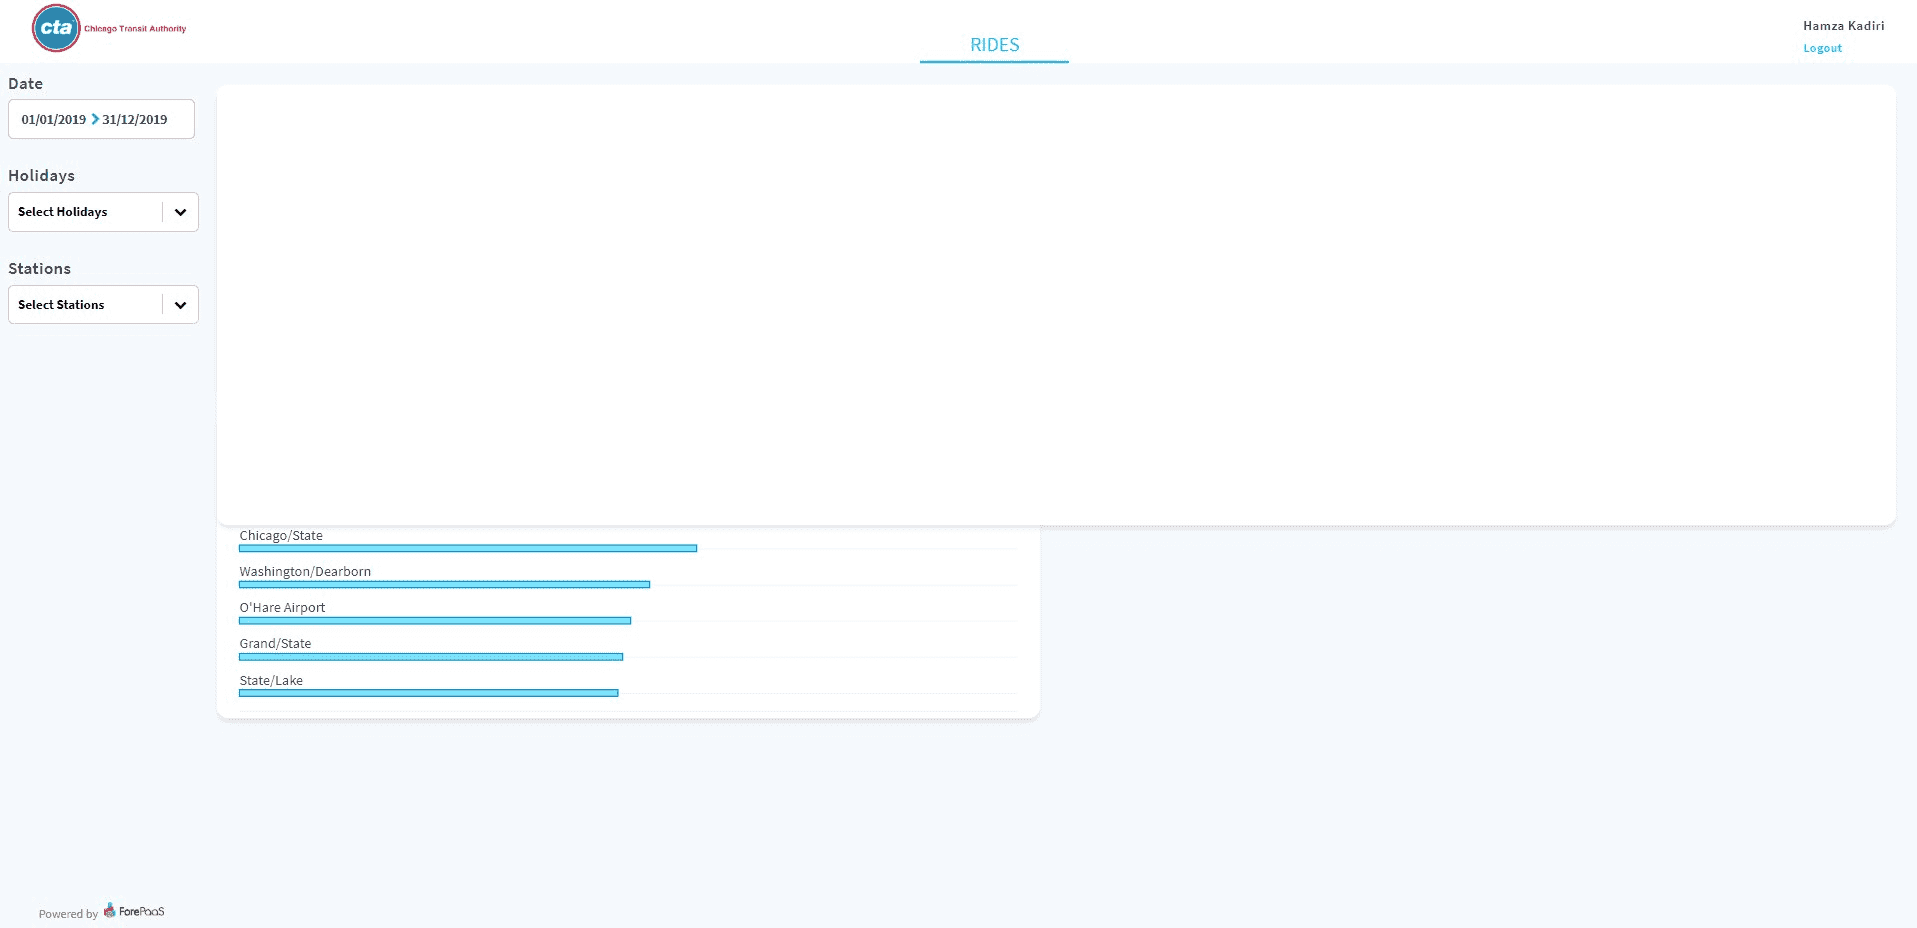
Now, edit the panel to reduce its height by changing the value of sizeY to 19.
After that, move all the other panels to the bottom by changing the value of row for each of them. Add 20 to the current value to push down the other panels.
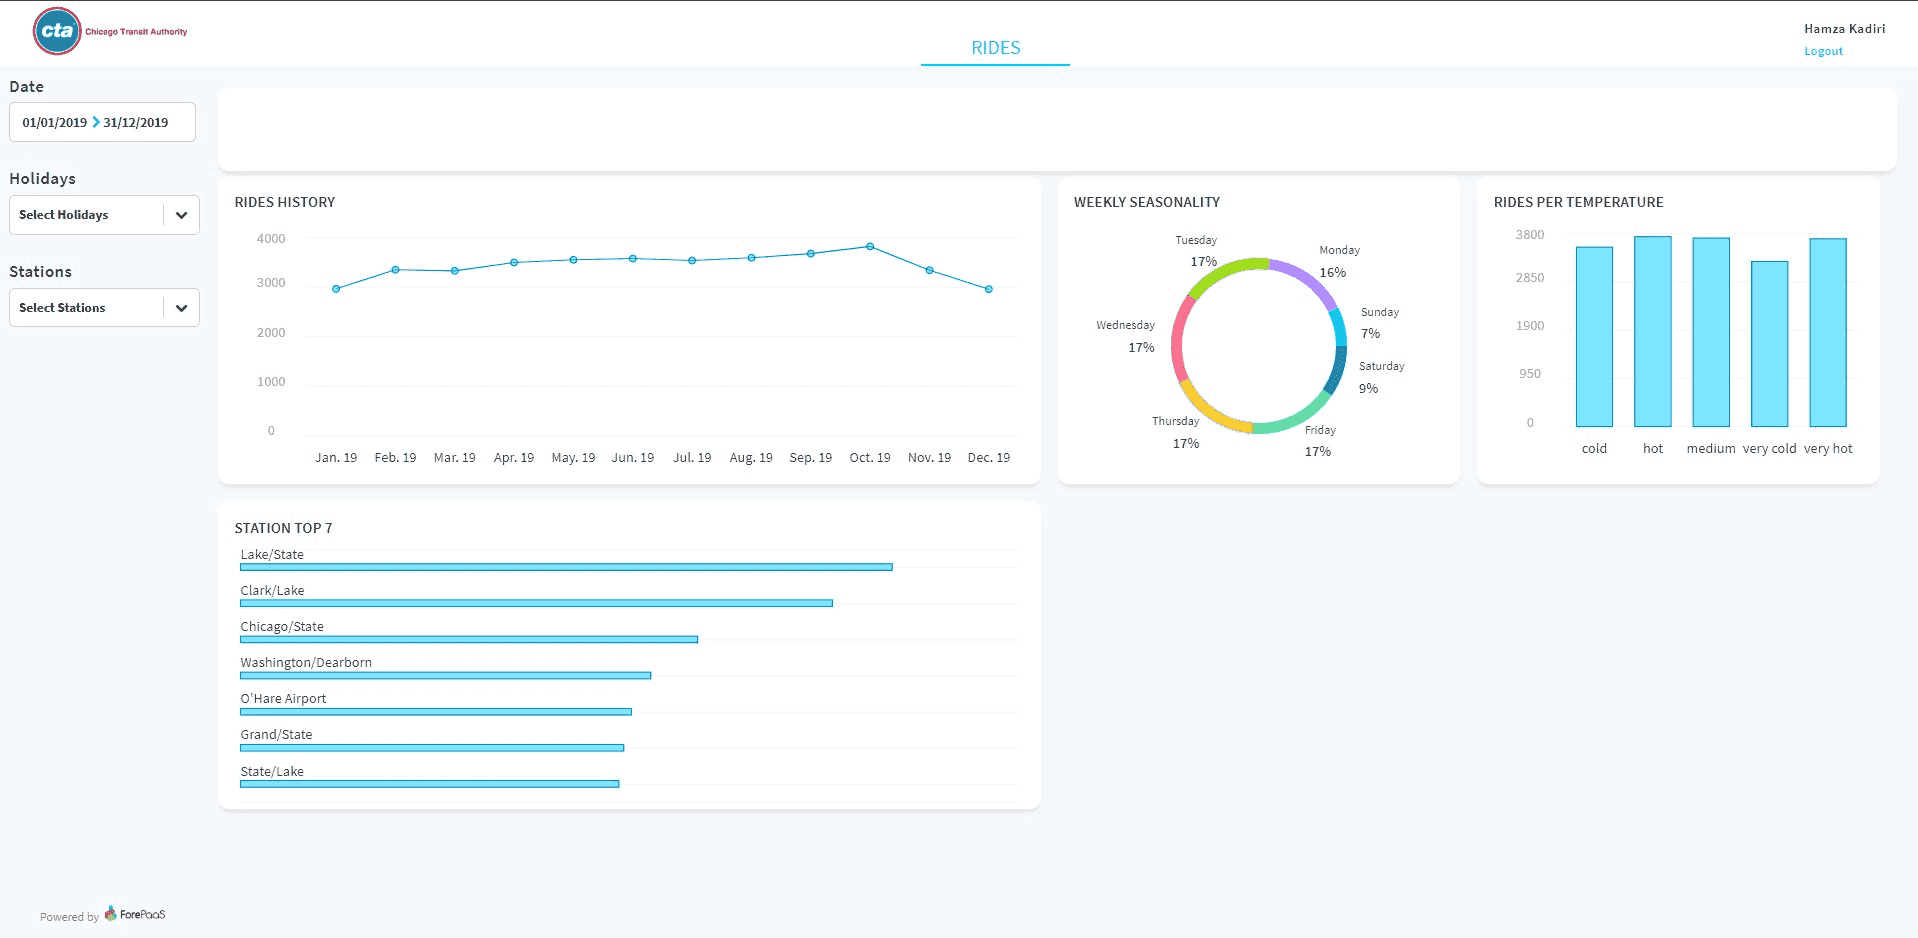
Now, to ensure the best possible viewing experience when we introduce our custom interactive map later in the tutorial, we'll make a strategic update to the dashboard's layout. This isn't just for aesthetics; it's designed to allow the map to co-exist gracefully with the rest of your dashboard. As part of this, we'll also add a new panel to serve as the perfect placeholder for our interactive map.
Replace the entire content of your rides-analytics.json file with the configuration provided below. Upon saving, you'll observe the updated dashboard layout.
rides-analytics.json
The layout of your rides analytics page is now ready.
Now we'll learn how to add a new dashboard to our application.
Generate a dashboard
To generate a new dashboard, create a new json file in config/dashboards.
You can speed up the process by using our script
Using the arrow keys choose dashboard, then type the name of your new dashboard ("learn" in this case)

To link your dashboard to your app, edit global.json by adding a new entry in the dashboarding section.
The key represents the url path of your new dashboard.
The value represents the path to the .json file associated with this dashboard.
Your new dashboard page should now be accessible at http://localhost:3333/#/learn.
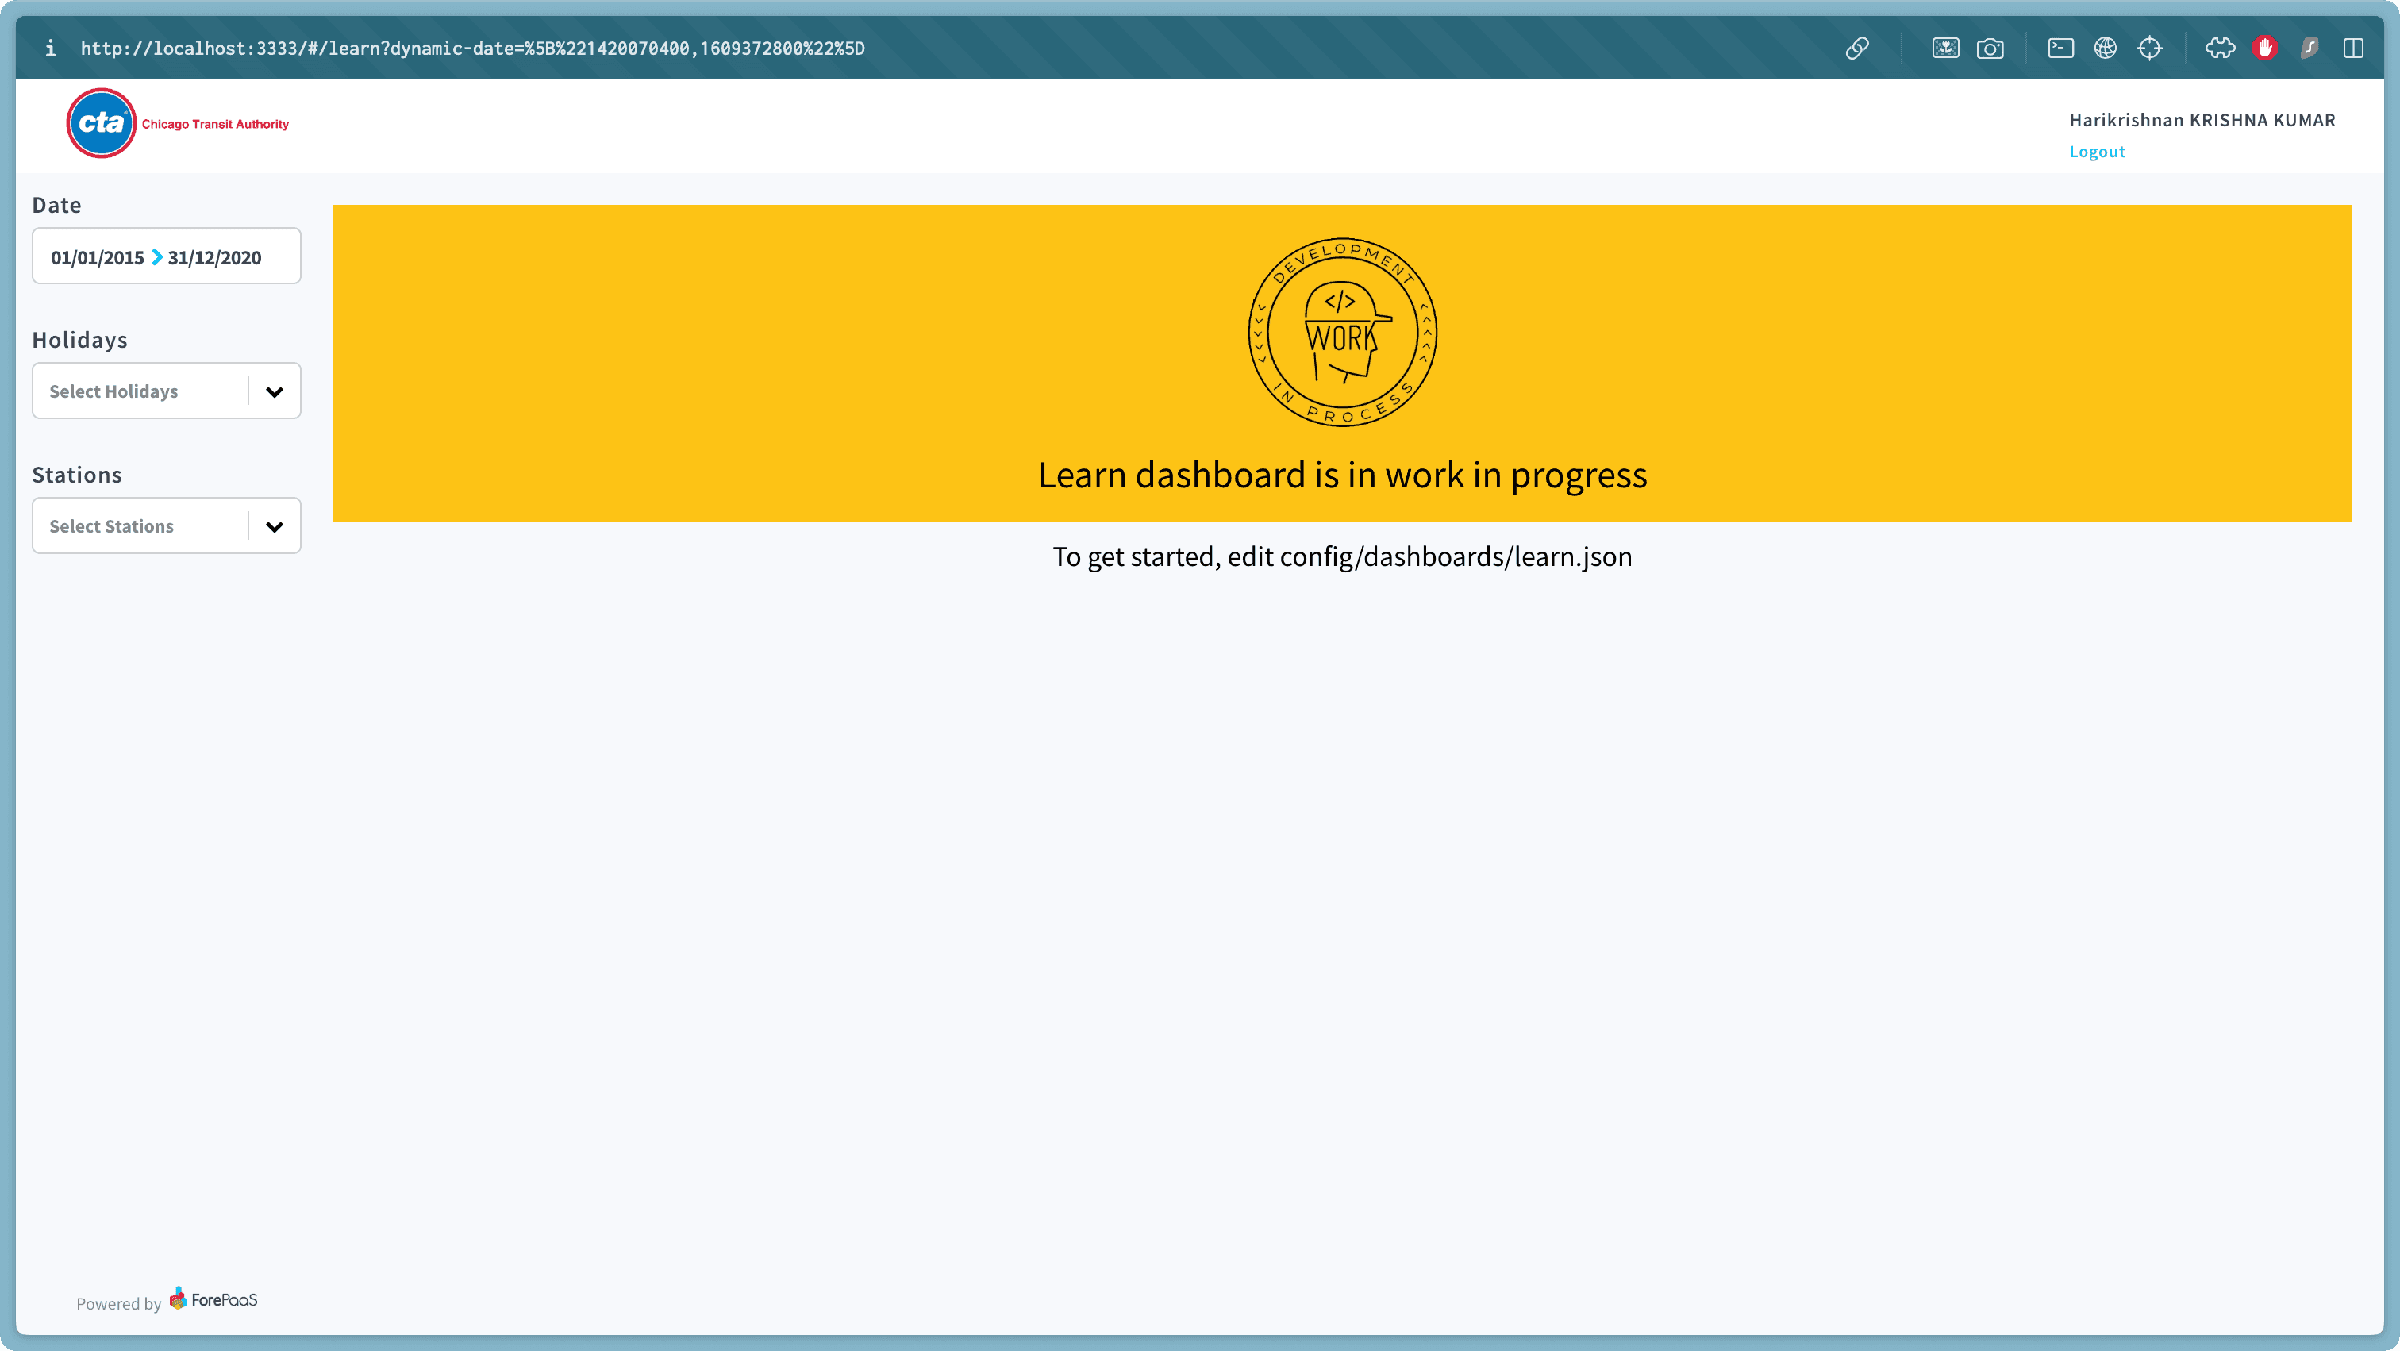
As a last step, we will need to enable access to this dashboard from the UI.
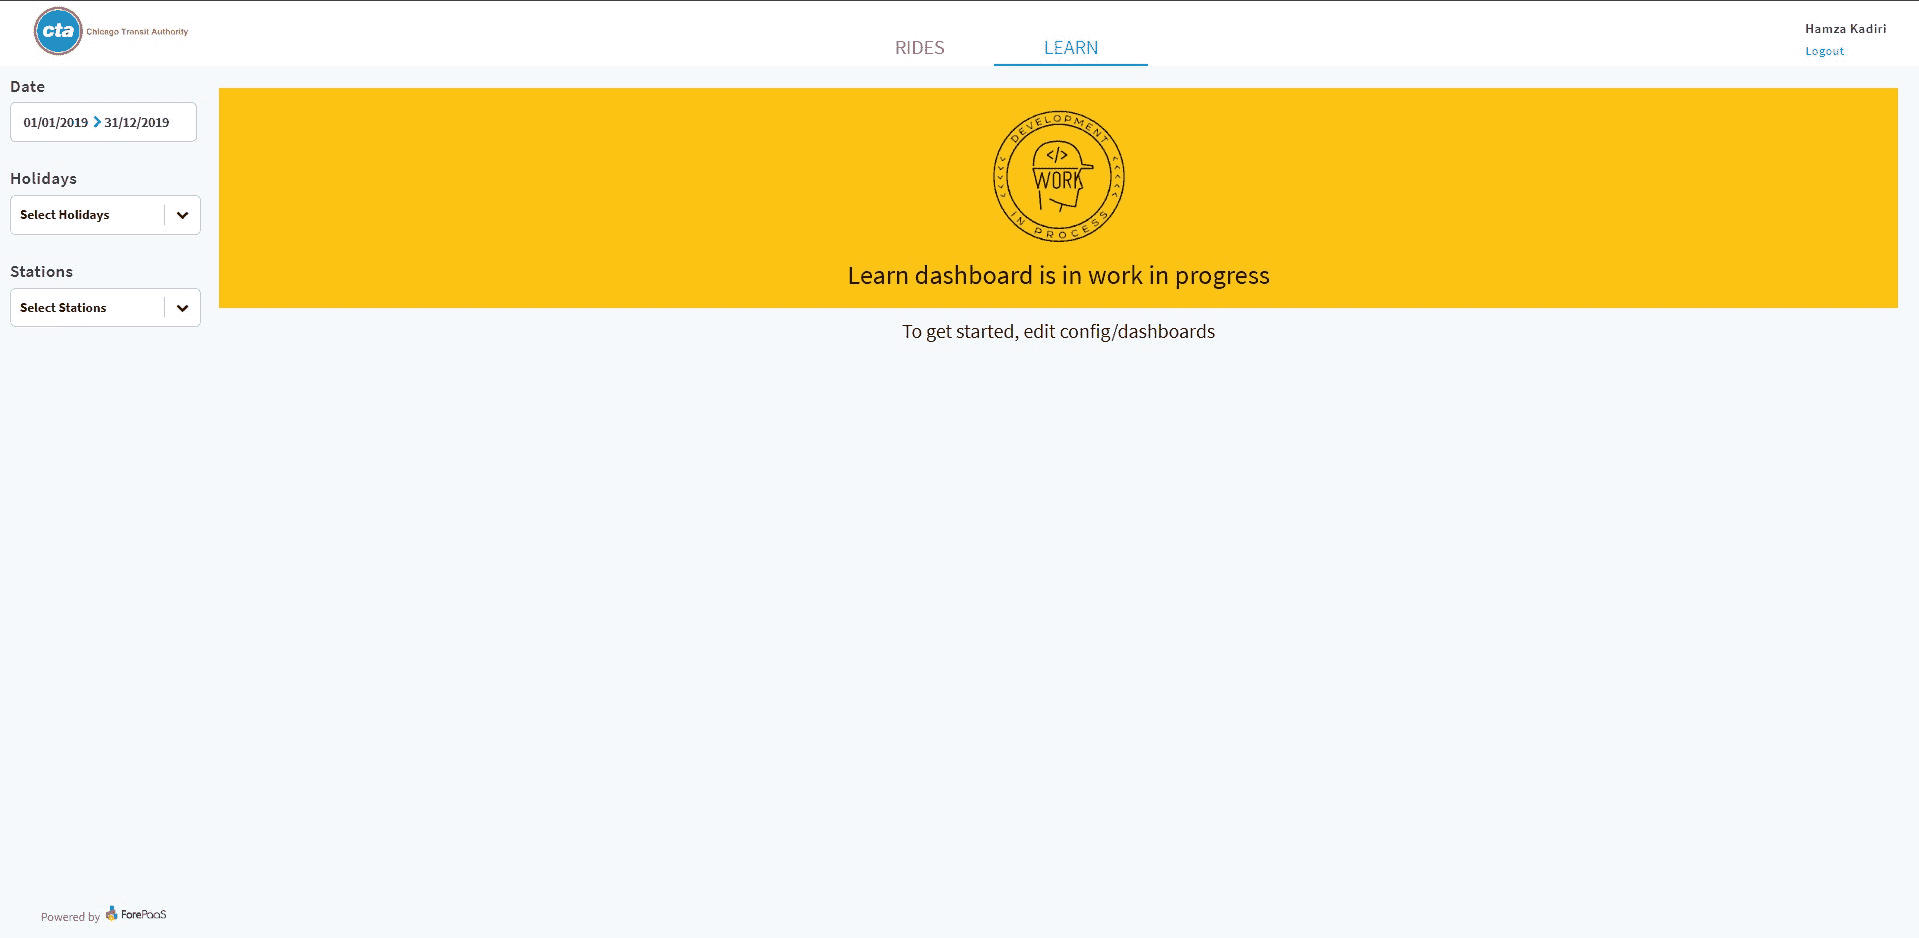
To do so, go to config/menus/header.json and add this entry in the items array of the tabs container:
This will allow us to easily switch between the two dashboards we have.
You're making good progress!
You are now familiar with the app architecture and how to work on it locally.
Let's introduce the topic of the next page: customizing your application. There are several ways you can use to style your components:
-
Use style templates: It allows you to define templates which will be applied by default.
-
Style at the component level: The style will be only applied to a specific component. You can achieve this by passing some props when declaring a chart or a dynamic parameter.
Example: Go toconfig/dashboards/rides-analytics.jsonand see the options field inside the line chart inside rides-history-container panel. -
Style at the module level (for dynamic parameter only): The style will be applied to all the dynamic parameter of this type. Example: properties passed inside
select-boxinstyle.json
Note: We recommend you use style templates for charts and style.json for dynamic parameters.
Deprecated for chart:
-
Style at the module level (eg. recharts): The style will be applied to all the components of the module.
Example: properties passed insiderechartsinstyle.json -
Style at the component type level (eg. recharts-bar): The style will be applied to all the components that share the specified component type
Example: properties passed insiderecharts-barinstyle.json
Ready to take on this challenge? 🧗🏽♂️ Let's learn how to create and edit charts!
Go further
If you need training or technical assistance to implement our solutions, contact your sales representative or click on this link to get a quote and ask our Professional Services experts for a custom analysis of your project.
Ask questions, give your feedback and interact directly with the team building the Data Platform on the dedicated Discord channel.
If you need support with your OVHcloud services, create a request in our Help Centre.
Join our community of users.