

Get started with your analytics application
The Getting Started guide will teach you how to create an analytics project using the Platform, through concrete examples and best practices
What you will build
The Getting Started guide will teach you how to create an analytics project using the Platform, through concrete examples and best practices. At the end of this tutorial, you will be completely self-sufficient. You’ll be able to create and deploy your own customized analytics application with sophisticated data processing.
Before you start. Access to Data Platform is set up once per organization: see Sign up and sign in. Then create a project, which takes about eight minutes to provision. The tutorial below assumes both are done.
The guide uses sample data, and demonstrates how to build an analytics application with predictive insights correlating subway traffic in the city of Chicago with weather variables and the time of the year.

Photo by Skyler Gerald on Unsplash
The guide walks through building that application step by step, from connecting the sample data to deploying the finished app.
Sounds interesting and exciting? Then let’s get started. It takes about 1 hour ⏱️ to complete.
We recommend using Chrome as your default browser. If you're using a different browser and face any issues, check out the link to our support portal to get in touch.
Setting-up your environment
Before you start working with data, you will need to set-up a working project environment. Your working environment is called a Project. It includes all the necessary tools and dedicated compute and storage resources you’ll need to build your analytics application.
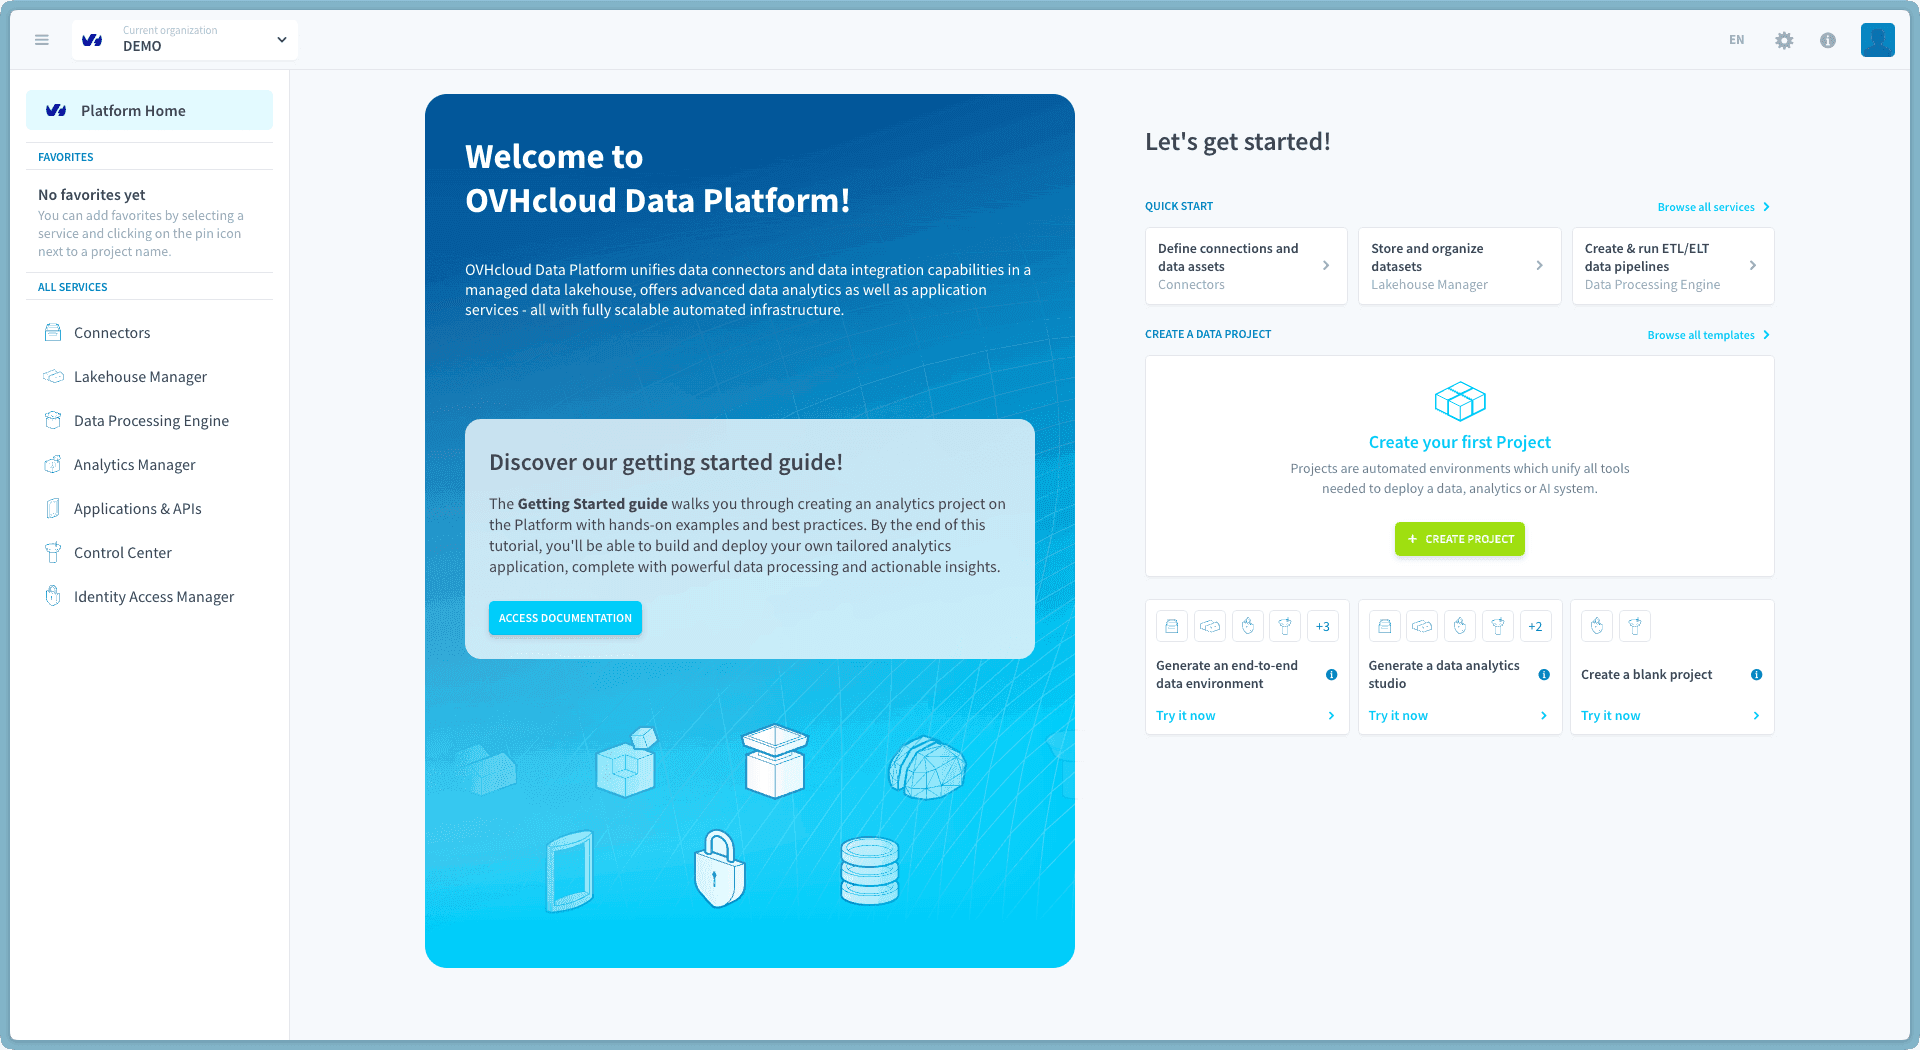
When asked, choose the template to create an end-to-end project. This will instantiate all the services on the Platform to be ready to use in your project.
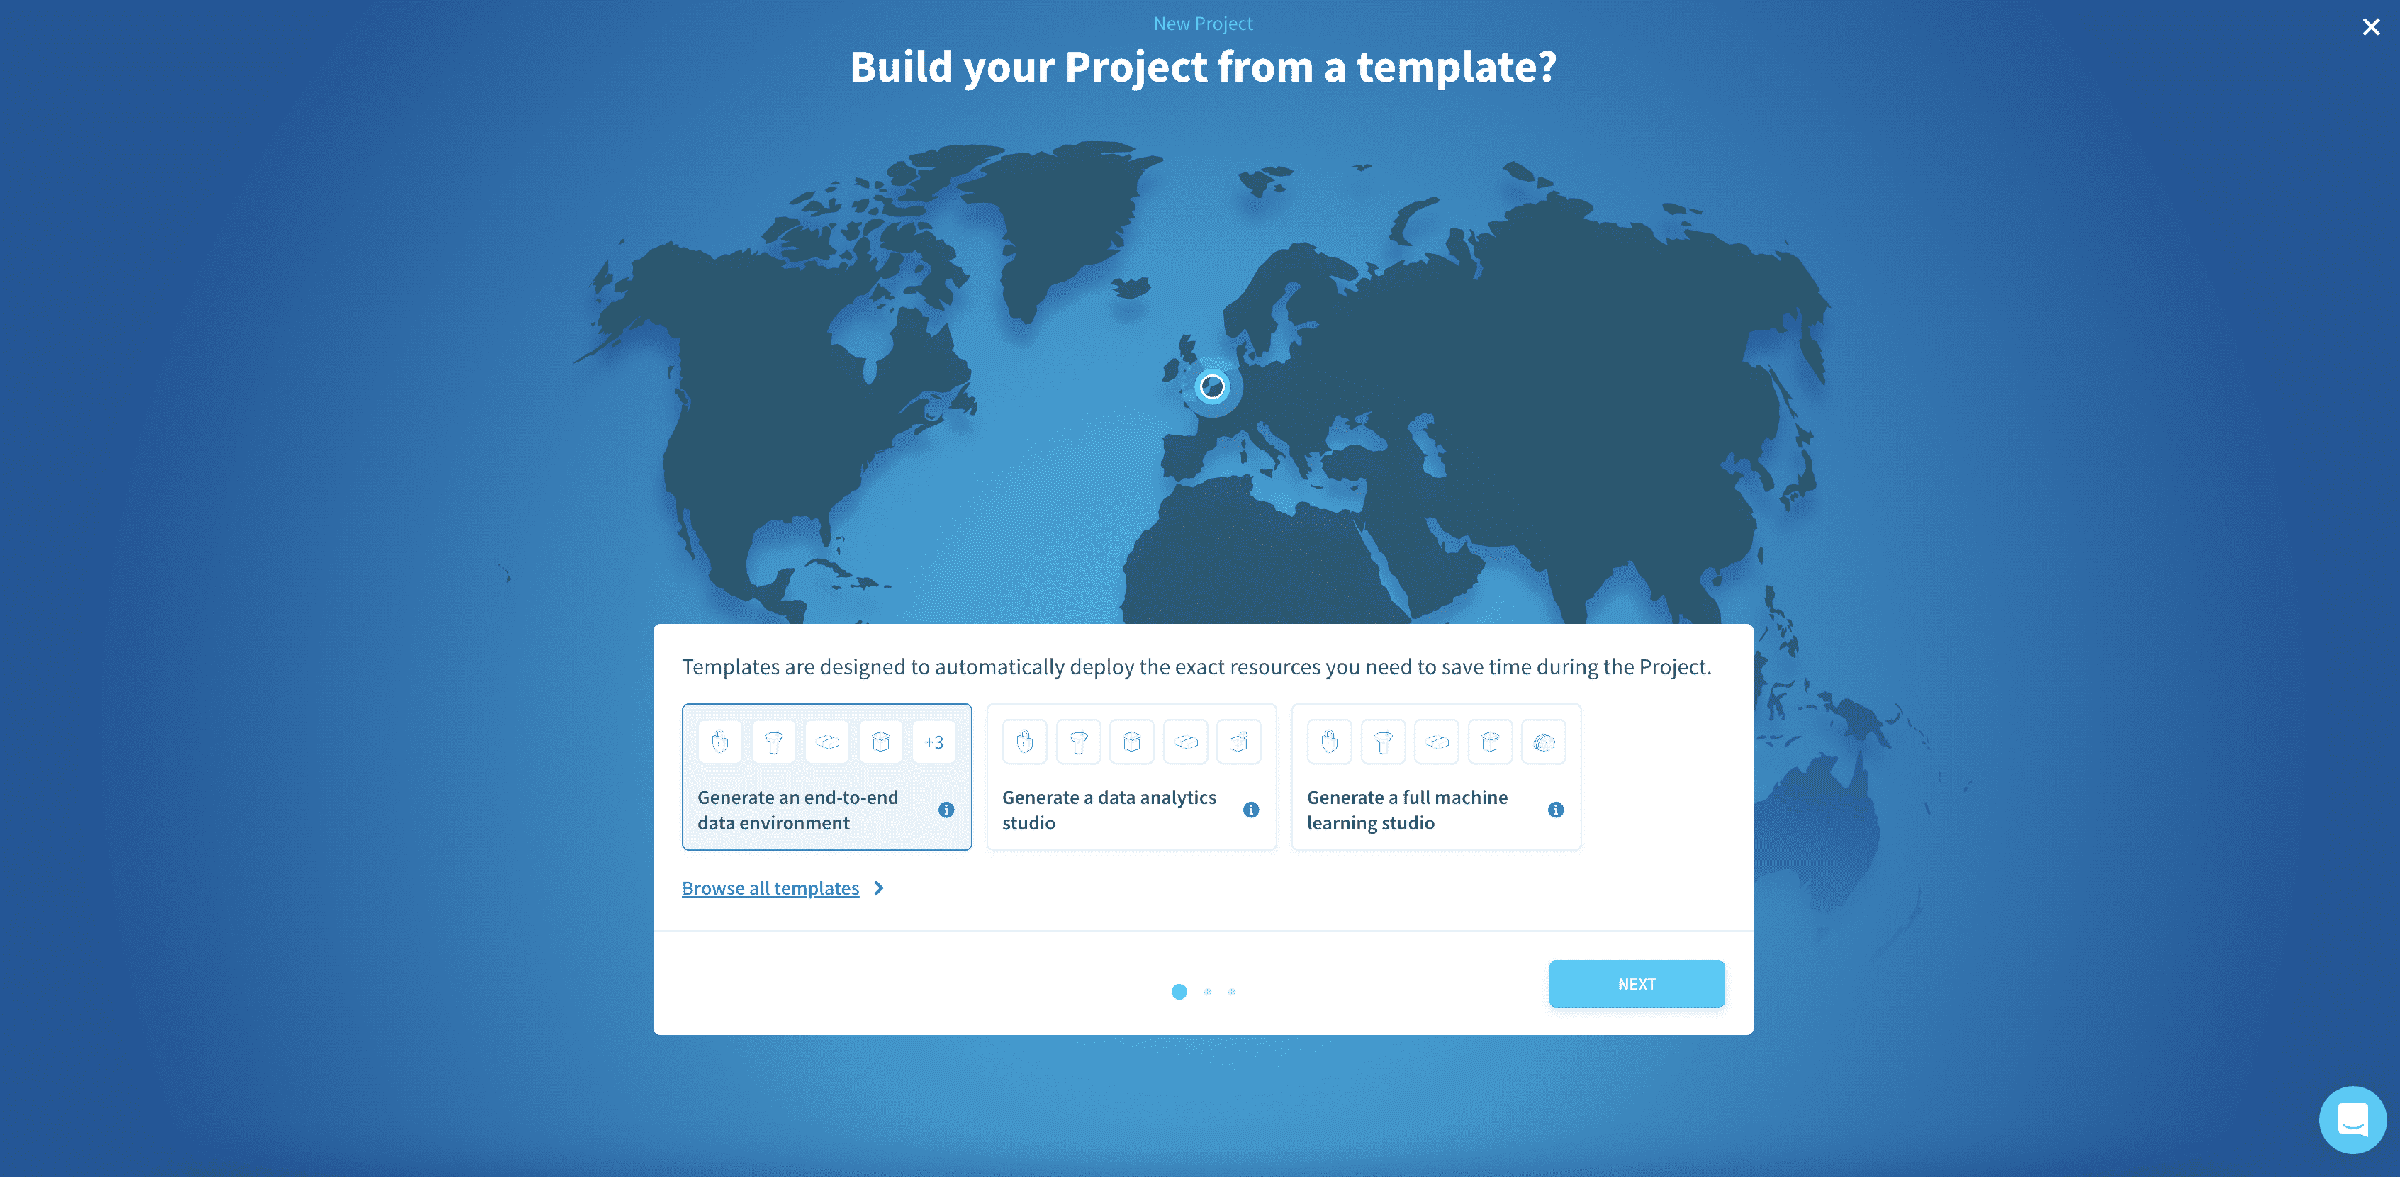
Proceed with the creation. Once you have spinned up a Project, open it to move on to creating your first application!
Build your analytics app from scratch on the Platform
The goal of this tutorial is to get you familiar with the Platform so that you can start creating your own applications as soon and as quickly as possible.
We'll walk you through the main steps to build a data visualization app in less than 1 hour.
The application to be built serves to visualize the rides in Chicago's railway stations. It will look like this by the end of this tutorial:
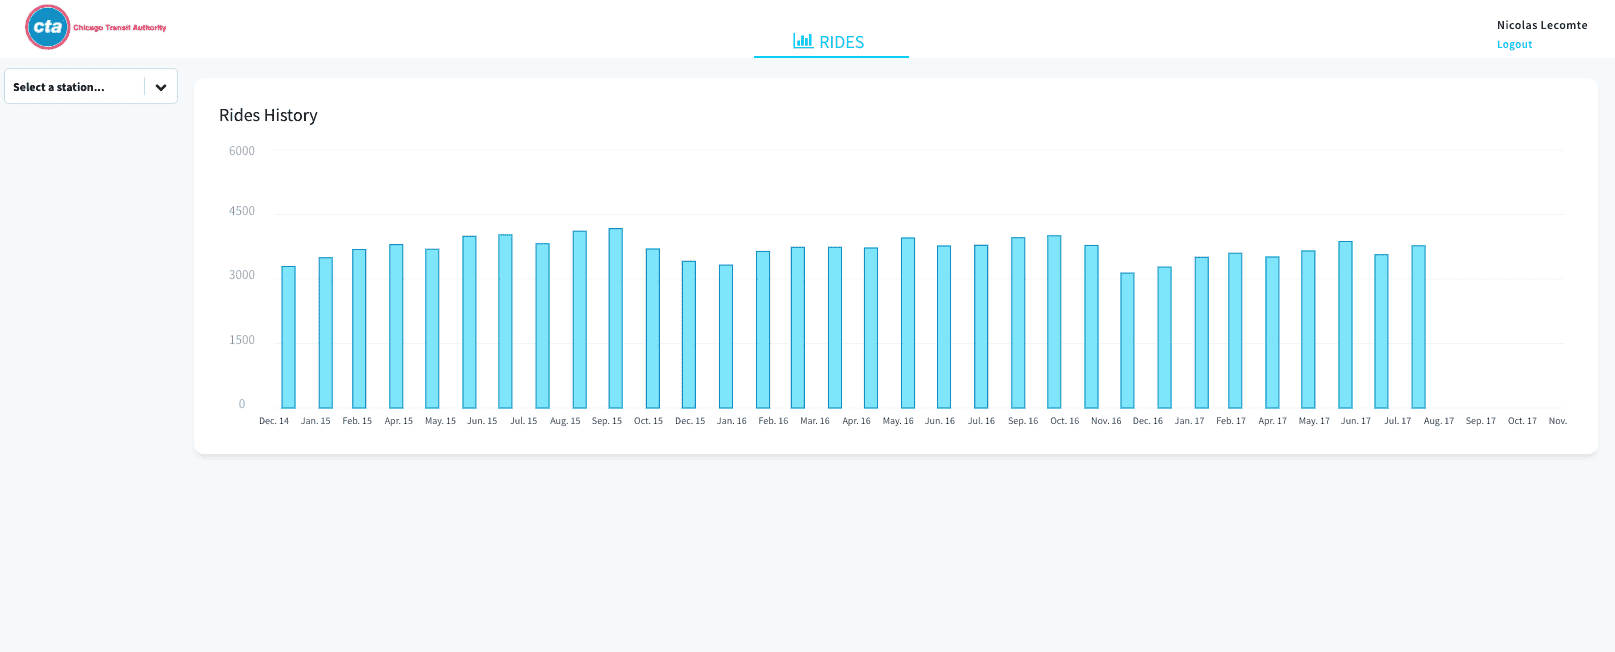
You will use sample datasets, and all the features and pre-written code provided for you by the Platform.
Six easy steps
After having created a Project, your data application will be created in 6 easy steps.
Define, analyze & clean your data sources
Connect sources in the Connectors
Create and Build your data models
Organize your data in the Lakehouse Manager

Create custom queries to retrieve data from your data model
Make queries in the Analytics Manager
Expose your data by deploying an API dedicated to your Project
Expose your data through an API
Create and deploy your front-end application
Visualize it on the APP Manager
Go further
If you need training or technical assistance to implement our solutions, contact your sales representative or click on this link to get a quote and ask our Professional Services experts for a custom analysis of your project.
Ask questions, give your feedback and interact directly with the team building the Data Platform on the dedicated Discord channel.
If you need support with your OVHcloud services, create a request in our Help Centre.
Join our community of users.